Page 133 - The Geological Interpretation of Well Logs
P. 133

-  THE  DENSITY  AND  PHOTOELECTRIC  FACTOR  LOGS  -

                                                 >
                                                 oO


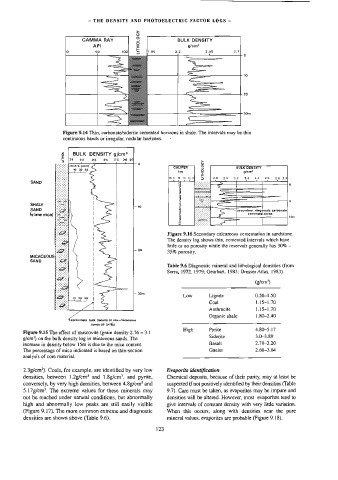
                              GAMMA  RAY         2             BULK  DENSITY
                                  API            x                 gicm*
                        0          50       wol   §    |r.96   2.2       2.45      27]


                                                                  =                    -


                           20


                           30m

                                                                  ee
                              =

                       Figure  9.14  Thin,  carbonate/siderite  cemented  horizons  ta  shale.  The  intervals  may  be  thin
                       continuous  bands  or  irregular,  nodular  horizons.

                       3  |  BULK  DENSITY  g/em®
                       5   21   22   23   24   25   26  27

                     a        7   :   ;      +    9                     LITHOLOGY


                                                                ins
                                                              uy
                                                                   14
                                                               o12
                                                                 19
            SAND
                                                            Figure  9.16  Secondary  calcareous  cementation  in  sandstone.
           SHALY                  |             L
            SAND     :            |               °                                 secondary,  diagenetic
           (same mica)  f:                                                              cemented  zones   10m
                                  |
                                  |
                                  |
                                                            The  density  log  shows  thin,  cemented  intervals  which  have
                                  |
                                  |
                                                            little  or  no  porosity  while  the  reservoir  generally  has  30%  —
                                                -  20
                                  |
                                                            35%  porosity.
            MICACEOUS|::
           SAND                   !
                                                            Table  9.6  Diagnostic  mineral  and  lithological  densities  (from
                                  |
                                                            Serta,  1972,  1979;  Gearhart,  1983;  Dresser  Atlas,  1983).
                                  |
                                  |              |  |  |  |   20m   Low   Lignite          (g/cm?)
                                  |

                                                                                           0.50-1.50
                                                                          Coal
                                                                                           1.15-1.70
                                                                          Anthracite       1,15-1.70
                                                                          Organic  shale   1.80-2.40
                         dum    bulk  density  of  non-micaceous
                                 sands (@  24%)
                                                                 High     Pyrite           4.80-5.17
         Figure  9.15  The  effect  of  muscovite  (grain  density  2.76  -  3.1
                                                                          Siderite         3.0-3.89
         g/cm?)  on  the  bulk  density  log  in  micaceous  sands.  The
         increase  in  density  below  15m  is  due  to  the  mica  content,   Basalt      2.70-3.20
         The  percentage  of  mica  indicated  is  based  on  thin-section   Gneiss        2.60-3.04
         analysis  of  core  material.
         2.3g/cm*).  Coals,  for  example,  are  identified  by  very  low   Evaporite  identification
         densities,  between  1.2g/cm*  and  1.8g/cm*,  and  pyrite,   Chemical  deposits,  because  of  their  purity,  may  at  least  be
         conversely,  by  very  high  densities,  between  4.8g/cm*  and   suspected  if not  positively  identified  by  their  densities  (Table
         5.17g/em*.  The  extreme  values  for  these  minerals  may   9.7).  Care  must  be  taken,  as  evaporites  may  be  impure  and
         not  be  reached  under  natural  conditions,  but  abnormally   densities  will  be  altered.  However,  most  evaporites  tend  to
         high  and  abnormally  low  peaks  are  still  easily  visible   give  intervals  of  constant  density  with  very  litle  variation.
         (Figure  9.17).  The  more  common  extreme  and  diagnostic   When  this  occurs,  along  with  densities  near  the  pure
         densities  are  shown  above  (Table  9.6).        mineral  values,  evaporites  are  probable  (Figure  9.18).
                                                        123
   128   129   130   131   132   133   134   135   136   137   138