
Page 128 - The Geological Interpretation of Well Logs
P. 128
- THE GEOLOGICAL INTERPRETATION OF WELL LOGS -
10.0 BS {in) 20, -.2500—
scale RHOB (G/C3
0.0 20
Depth {| 2.40g/cm*
LOG
4150m
log
caving}
117m
10 15 20 2.0 2.2 23 24 26 26 27 28 29
Caliper scale, inches Density log scale. g/cm?
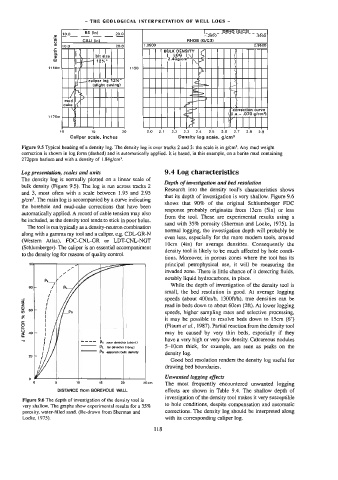
Figure 9.5 Typical heading of a density log. The density log is over tracks 2 and 3: the scale is in g/crn®. Any mud weight
correction is shown in log form (dashed) and is automatically applied. It is based, ia this example, on a barite mud containing
272ppm barium and with a density of |.84g/cm’.
Log presentation, scales and units 9.4 Log characteristics
The density log is normally plotted on a linear scale of
Depth of investigation and bed resolution
bulk density (Figure 9.5). The log is run across tracks 2
Research into the density tool’s characteristics shows
and 3, most often with a scale between 1.95 and 2.95
that its depth of investigation is very shallow. Figure 9.6
g/cm?. The main log is accompanied by a curve indicating
shows that 90% of the original Schlumberger FDC
the borehole and mud-cake corrections that have been
response probably originates from 13cm (Sin) or less
automatically applied. A record of cable tension may also
from the tool. These are experimental results using a
be included, as the density tool tends to stick in poor holes.
sand with 35% porosity (Sherman and Locke, 1975). In
The tool is run typically as a density-nevtron combination
normal logging, the investigation depth will probably be
along with a gamma ray tool and a caliper, e.g. CDL-GR-N
even less, especially for the more modem tools, around
(Western Atlas), FDC-CNL-GR or LDT-CNL-NGT
10cm (4in) for average densities. Consequently the
(Schlumberger). The caliper is an essential accompaniment
density tool is likely to be much affected by hole condi-
to the density log for reasons of quality control.
tions. Moreover, in porous zones where the too} has its
principal petrophysical use, it will be measuring the
invaded zone. There is little chance of it detecting fluids.
notably liquid hydrocarbons, in place.
While the depth of investigation of the density tool is
small, the bed resolution is good. At average logging
SIGNAL speeds (about 400m/h, 1300ft/h), true densities can be
read in beds down to about 60cm (2ft). At lower logging
% speeds, higher sampling rates and selective processing,
it may be possible to resolve beds down to 15cm (6")
FACTOR (Flaum et af., 1987). Partial reaction from the density too]
may be caused by very thin beds, especially if they
J have a very high or very low density. Caicareous nodules
———— Ps near detector ishort)
PL tar detector (long) 5—10cm thick, for example, are seen as peaks on the
drawing bed boundaries.
Pp epparent bulk dansity
density log.
Good bed resolution renders the density log useful for
Unwanted logging effects
10 18 20 25m.
The most frequently encountered unwanted logging
DISTANCE from BOREHOLE WALL effects are shown in Table 9.4. The shallow depth of
investigation of the density tool makes it very susceptible
Figure 9.6 The depth of investigation of the density tool is
very shallow. The graphs show experimental results for a 35% to hole conditions, despite compensation and automatic
porosity, water-filled sand. (Re-drawn from Sherman and corrections. The density log should be interpreted along
Locke, 1975). with its corresponding caliper log.