
Page 124 - The Geological Interpretation of Well Logs
P. 124
- THE GEOLOGICAL INTERPRETATION OF WELL LOGS -
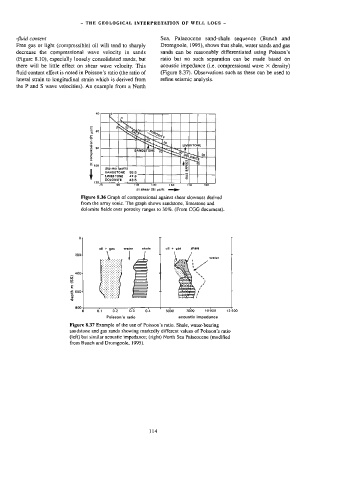
-fluid content Sea, Palaeocene sand-shale sequence (Bunch and
Free gas or light (compressible) oil will tend to sharply Dromgoole, 1995), shows that shale, water sands and gas
decrease the compressional wave velocity in sands sands can be reasonably differentiated using Poisson's
(Figure 8.10), especially loosely consolidated sands, but rao but no such separation can be made based on
there will be little effect on shear wave velocity. This acoustic impedance (i.e. compressional wave X density)
fluid content effect is noted in Poisson’s ratio (the ratio of (Figure §.37). Observations such as these can be used to
lateral strain to longitudinal strain which is derived from, refine seismic analysis.
the P and S wave velocities). An example from a North
g 6
&
¢
2
ad
% 80
2
a
—
°
o
< $00 dtp ma (usfit} 65.5
SANDSTONE
LIMESTONE
47.6
43.5
OCGLOMITE
1
At shear {S) ps/ft —e
Figure 8.36 Graph of compressional against shear slowness derived
from the array sonic, The graph shows sandstone, limestone and
dolomite fields over porosity ranges to 30%. (From CGG document).
"]
oll + gas water shale oil + gas shale
2004
water
4004
a
2
—
£ 600+
a
2
2
800
+
T
—
Q O41 0.2 O.3 5000 7500 10 000 12.500
Poisson's ratio acoustic impedance
Figure 8.37 Example of the use of Poisson’s ratio. Shale, water-bearing
sandstone and gas sands showing markedly different values of Poisson’s ratio
(left) but similar acoustic impedance; (right) North Sea Palaeocene (modified
from Bunch and Dromgoole, 1995).