Page 121 - The Geological Interpretation of Well Logs
P. 121

-  SONIC  OR  ACOUSTIC  LOGS  -


      Data  output,  velocity  picking                  wave  arrival  times  and  slowness  values  requires  special
      With  a  full,  digital  waveform  from  all  of  the  receivers  in   processing.  For  example,  the  output  from  an  eight
      an  afray  at  each  sampling  depth,  separating  the  various   receiver  array  provides  8  waveforms  with  different  off-
                                                        sets  (Figures  8.31,  8.334).  To  derive  the  separate  P,  S  and
                                                        St  wave  velocities  (slowness)  various  methods  are  used
                                                        comparable  to  stacking  in  seismic  processing  (Block  ef
                               transmitted  signal
                                                        al.,  1991).  Effectively,  the  data  from  the  individual  traces
                                                        are  combined  in  such  a  way  as  to  enhance  individual
                                                        wave  information  and  diminish  noise  or  other  unwanted
                                                        effects.  Typically,  at  each  depth,  a  map  in  a  time-velocity
                                                         domain  is  produced  (Figure  8.335)  from  which  individual
                                                         wave  slowness  values  can  be  picked  and  a  log  of  slowness
                                                         against  depth  produced.
                                                           A  complication  arises  using  tools  with  only  monopole
                               received  signals        and  the  Stoneley  energy  cannot  be  separated.  In  order  to
                                                         transmitters  in  ‘slow’  formations  where  the  shear  energy
                                                        have  shear  velocity  with  this  data,  it  is  modeiled  from
                                                         the  Stoneley  information  and  an  interpreted  shear  arrival
                                                         is  given.  With  the  dipole  transmitters,  direct  detectian
                                                        of  the  shear  arrival  is  possible  in  both  ‘fast’  and  ‘slow’
                                 time  ——»              size  used  in  the  processing  gather  or  the  gather  technique.
                                                         formations,  as  indicated  above.
                                                           The  resolution  of  the  array  tools  is  related  to  the  array

                                                        This  wilt  be  the  vertical  height  of  the  array  or  1.07m
                                                         (3.5ft)  for  the  DSI  of  Schlumberger  (Figure  8.32).  A  bed
                                                        thinner  than  the  array  gather  will  still  be  indicated  and  in
               I  =  incremental  path
                                                         its  real  depth  position,  but  it  will  not  be  fully  resolved
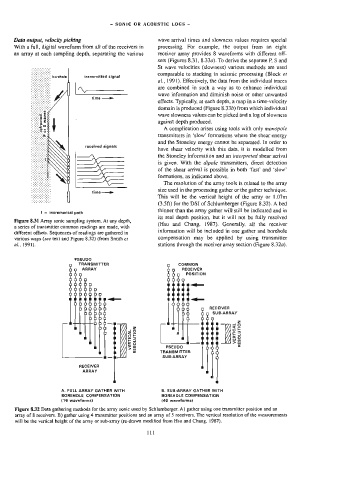
      Figure  8.31  Array  sonic  sampling  system.  At  any  depth,
                                                        (Hsu  and  Chang,  1987).  Generally,  alt  the  receiver
      a  series  of  transmitter  common  readings  are  made,  with
                                                         information  will  be  included  in  one  gather  and  borehole
      different  offsets.  Sequences  of  readings  are  gathered  in
      various  ways  (see  text  and  Figure  8.32)  (from  Smith  er   compensation  may  be  applied  by  using  transmitter
      al.,  1991).                                       stations  through  the  receiver  array  section  (Figure  8.32a).
                           PSEUDO
                             TRANSMITTER                        COMMGN
                              ARRAY                              RECEIVER
                                                                  POSITION
                                                                    _——

                                        —_————                      <——
                                                                           RECEIVER
                                                                            SUB-ARRAY

                                              26
                                              Se                                    VERTICAL   RESOLUTION
                                              Ed
                                              $e           PSEUDO
                                                ec       TRANSMITTER
                                                          SUB-ARRAY
                             RECEIVER
                              ARRAY


                       A.  FULL  ARRAY  GATHER  WITH      B.  SUB-ARRAY  GATHER  WITH
                       BOREHOLE  COMPENSATIGN             BOREHOLE  COMPENSATION
                       {16  waveforms)                    (40  waveforms)
      Figure  $.32  Data  gathering  methods  for  the  array  sonic  used  by  Schlumberger.  A)  gather  using  one  transmitter  position  and  an
      array  of  8  receivers.  B)  gather  using  4  transmitter  positions  and  an  array  of  5  receivers.  The  vertical  resolution  of  the  measurements
      will  be  the  vertical  height  of  the  array  or  sub-array  (re-drawn  modified  from  Hsu  and  Chang,  1987).
   116   117   118   119   120   121   122   123   124   125   126