
Page 126 - The Geological Interpretation of Well Logs
P. 126
- THE GEOLOGICAL INTERPRETATION OF WELL LOGS -
Table 9.1 The principal uses of the density log.
Discipline Used for Knowing
Quantitative Petrophysics Porosity Matrix density
Fluid density
Seismic Acoustic impedance (Use raw log)
Qualitative and Geology General Lithology Combined with neutron*
semi-quantitative Shale textura] changes Average trends
Mineral identification Mineral densities
Reservoir geology Overpressure identification Average trends
Fracture recognition Sonic porosities
Geochemistry Source rock evaluation Density — O.M. calibration
*using density log combined with neutron log on compatible scale
9.2 Principles of measurement density are almost identical, there are differences when
water (hydrogen) is involved. For this reason, the actual
The logging technique of the density tool is to subject the
values presented on the density log are transformed to
formation to a bombardment of medium-high energy
give actual values of calcite (2.71g/cm*) and pure water
(0.2-2.0 MeV) collimated (focused) gamma rays and to
(1.00g/cm*) (Table 9.2). (There are still slight differences
measure their attenuation between the tool source and
between log density and real density, especially when
detectors. Such is the physical relationship that the
chlorine is involved.)
attenuation (Compton scattering, see Section 7.2) is a
function of the number of electrons that the formation
9.3 Tools
contains — its electron density (electrons/cm?) — which in
turn is very closely related to its common density (g/cm’) The standard density tools have a collimated gamma ray
(Table 9.2). In dense formations, Compton scattering source (usually radiocaesium which emits gamma rays at
attenuation is extreme and few detectable gamma rays 662 keV, but radiocobali is also used} and two detectors
reach the tool’s detectors, while in a lesser density the (near and far) which allow compensation for borehole
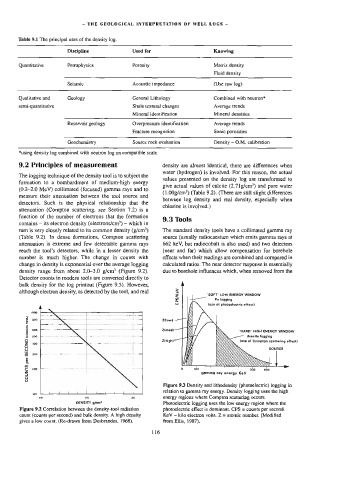
number is much higher. The change in counts with effects when their readings are combined and compared in
change in density is exponential over the average logging calculated ratios. The near detector response is essentially
density range from about 2.0-3.0 g/cm’ (Figure 9.2). due to borehole influences which, when removed from the
Detector counts in modern tools are converted directly to
buJk density for the Jog printout (Figure 9.5). However, A
CPS/KeV
although electron density, as detected by the tool, and real
“SOFT’ LOW ENERGY WINDOW
Pa logging
luse of photoelectric effect)
_——
(Loccinc 1001) Zilow} ——"] RMT —_— “HARD‘ HIGH ENERGY WINDOW
Zimed)
density logging
SECOND Zthigh)—~ | SOURCE
luse of Compton scattering effect)
WW
ot
ah
oY
we
per
COUNTS 200 [7 gamma ray energy KeV 500
Figure 9.3 Density and lithodensity (photoelectric) logging in
100 relation to gamma ray energy. Density logging uses the high
energy regions where Compton scattering occurs.
20
DENSITY g/em? Photoelectric logging uses the low energy region where the
Figure 9,2 Correlation between the denstty-tool radiation photoelectric effect is dominant. CPS = counts per second.
count (counts per second) and bulk density. A high density Ke¥ — kilo electron volts. Z = atomic number. (Modified
gives a low count. (Re-drawn from Desbrandes, 1968). from Ellis, 1987).
116