
Page 130 - The Geological Interpretation of Well Logs
P. 130
!
- THE GEOLOGICAL INTERPRETATION OF WELL LOGS -
|
!
|
|
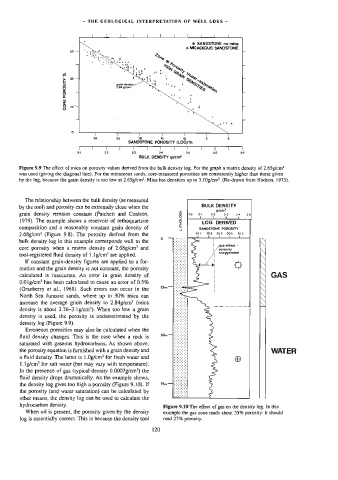
® SANDSTONE no mica
0 MICACEOUS SANDSTONE
%
POROSITY
CORE
i t |
40 2s 20 18 40
SANDSTONE POROSITY (LOG) %
I I | | I | | I | | ro]
a1 22 23 24 25 26 27
BULK DENSITY g/cm*
Figure 9.9 The effect of mica on porosity values derived from the bulk density tog. For the graph a matrix density of 2.65g/cm>
was used (giving the diagonal line). For the micaceous sands, core-measured porosities are consistently higher than those given
by the log, because the grain density is too low at 2,65g/cm’. Mica has densities up to 3.10g/cm*. (Re-drawn from Hodson, 1975).
The relationship between the bulk density (as measured
by the tool) and porosity can be extremely close when the BULK DENSITY
gem?
LITHOLOGY J 1 J \
2-2
24a
230
2002
grain density remains constant (Patchett and Coalson,
2S
1979), The example shows a reservoir of orthoquartzite LOG DERIVED
composition and a reasonably constant grain density of SANDSTONE POROSITY
2.68g/cm* (Figure 9.8). The porosity derived from the Ge 30% 25% 20% 1BK
J !
bulk density log in this example corresponds well to the R
| | gas afiect -
core porosity when a matrix density of 2.68g/cm* and |/ Roresity h
eaagg erated
tool-registered fluid density of ].1g/cm’ are applied.
If constant grain-density figures are applied to a for-
mation and the grain density is not constant, the porosity
calculated is inaccurate. An error in grain density of GAS
0.01g/cm? has been calculated to cause an error of 0.5%
25m":
(Granberry et ai., 1968). Such errors can occur in the
North Sea Jurassic sands, where up to 30% mica can
increase the average grain density to 2.84g/cm* (mica Ve
density is about 2.76-3.1g/cm?). When too Sow a grain
density is used, the porosity is underestimated by the
density log (Figure 9.9).
Erroneous porosities may also be calculated when the
50m7-] °°
fluid density changes. This is the case when a rock is
saturated with gaseous hydrocarbons. As shown above,
the porosity equation is furnished with a grain density and WATER
a fluid density. The latter is 1.0g/cm? for fresh water and
1.1g/cm? for salt water (but may vary with temperature).
In the presence of gas (typical density 0.0007g/cm’) the
fluid density drops dramatically. As the example shows,
the density log gives too high a porosity (Figure 9,10). If 7$m~—j
the porosity (and water saturation) can be calculated by
other means, the density log can be used to calculate the
hydrocarbon density. Figure 9.10 The effect of gas on the density log. In this
When oil is present, the porosity given by the density example the gas zone reads about 35% porosity: it should
log is essentially correct. This is because the density tool read 27% porosity.
120