Page 134 - The Geological Interpretation of Well Logs
P. 134

-  THE  GEOLOGICAL  ENTERPRETATION  OF  WELL  LOGS  -
                               LITHOLOGY

                CALIPER
                  ins                          BULK  DENSITY  g/cm
                                      2-0   24   22   23   24   25   2-6   27   28   29   30
                                                                       4
                                                     L
                                               |
                                                          1
                                                                           1
                                                                   ll
                                                                —
                                                               1
                                                                             —_|

                                   PYRITE  Shate
                                                               |
                                                                                            low  peak
                                                                                      Sm    2.02  gyem3
                                     AL
                   }                    with
                                 zy  Ti   below
                                                                                            high  peak
                                   Bedded  PYRITE
                                                                                            2.8  g/cm?
                     a
                                       10m
                                  |  silt
                   |


                                                                                      13m
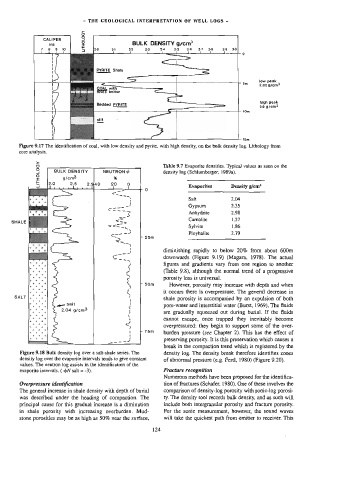
        Figure  9.17  The  identification  of  coal,  with  low  density  and  pyrite,  with  high  density,  on  the  bulk  density  log.  Lithology  from
        core  analysis.
              >
              oO                                          Table  9.7  Evaporite  densities.  Typica)  values  as  seen  on  the

              G     BULK  DENSITY    NEUTRON  @           density  log  (Schlumberger,  1989a).
              2        a/oms             %

              EF   2.0    2.5    340    20
                     0
                 po            24        1    ?                    Evaporites     Density  g/em?
              2

                                               t                   Salt           2,04
                                            _-t
                                                                   Gypsum         2.35
                                       Teen
                                                                  Anhydrite       2.98
                                           <-°
                                                                   Carnalite      1.57
     SHALE                                <=>
                                       <=<-2_L                     Sylvite        1,86
                                             sy
                                         —-”                       Ployhalite     2.79
                                        SS        +  25m

                                             en
                                              5)
                                               t          diminishing  rapidly  to  below  20%  from  about  600m
                                                          downwards  (Figure  9.19)  (Magara,  1978).  The  actual
                                         7A
           +   bh   +
           watt                               ,  <        figures  and  gradients  vary  from  one  region  to  another
                                                          (Table  9.8),  although  the  normal  trend  of  a  progressive
             +   +   +                       xv
            tet                              ~~
                                                          porosity  loss  is  universal.
            a   es
                                                            However,  porosity  may  increase  with  depth  and  when
                                                          ii  occurs  there  is  overpressure.  The  general  decrease  in
            erage                             &
      SALT   a4?                              ;           shale  porosity  is  accompanied  by  an  expulsion  of  both
             +   +   #                         \
           tote      ape  Salt                é           pore-water  and  interstitial  water  (Burst,  1969).  The  fluids
           ote         2.04  g/m              5           are  gradually  squeezed  out  during  burial.  If  the  fluids
            t   +                             4
                7
            +   ‘                                         cannot  escape,  once  trapped  they  inevitably  become
                                              \
           aan                               <)           overpressured:  they  begin  to  support  some  of  the  over-
           aay                                 1   r  75m   burden  pressure  (see  Chapter  2).  This  has  the  effect  of
               +   +                   __--4   {          preserving  porosity,  It  is  this  preservation  which  causes  a

                                                          break  in  the  compaction  trend  which  is  registered  by  the
        Figure  9,18  Bulk  density  log  over  a  salt-shale  series.  The   density  log.  The  density  break  therefore  identifies  zones
        density  log  over  the  evaporite  intervals  tends  to  give  constant
                                                          of  abnormal  pressure  (e.g.  Fertl,  1980)  (Figure  9.20).
        values.  The  neutron  log  assists  in  the  identification  of  the
        evaporite  intervals.  (  >N  salt  =  -3).       Fracture  recognition
                                                          Numerous  methods  have  been  proposed  for  the  identifica-
        Overpressure  identification                      tion  of  fractures  (Schafer,  1980).  One  of  these  involves  the
        The  general  increase  in  shale  density  with  depth  of  burial   comparison  of  density-log  porosity  with  sonic-log  porosi-
        was  described  under  the  heading  of  compaction.  The   ty.  The  density  tool  records  bulk  density,  and  as  such  will
        principal  cause  for  this  gradual  increase  is  a  diminution   include  both  intergranular  porosity  and  fracture  porosity.
        in  shale  porosity  with  increasing  overburden.  Mud-   For  the  sonic  measurement,  however,  the  sound  waves
        stone  porosities  may  be  as  high  as  50%  near  the  surface,   will  take  the  quickest  path  from  emitter  to  receiver.  This
                                                       124
   129   130   131   132   133   134   135   136   137   138   139