
Page 131 - The Geological Interpretation of Well Logs
P. 131
- THE DENSITY AND PHOTOELECTRIC FACTOR LOGS -
investigates the flushed zone (see ‘Depth of investigation’, Although the density log is itself a poor indicator of
Section 9.4) where only a small volume of oi] remains. lithology, combined with the neutron log it becomes
Moreover, the density of oil is quite close to that of water excellent. In fact the neutron-density log combination is
(0.7 g/cm? vs. 1.0g/cm>). Gas, however, is more mobile probably the best qualitative indicator of general litholo-
and frequently occurs in the flushed zone where, because gy especially in the presence of a valid PEF curve. The
of the large density difference with water, it has the effect subject is described in Chapter 10 (see ‘Neutron-density
of diminishing the bulk density as described above. combination’).
Acoustic impedance The density log in shales: compaction,
The density log is used in conjunction with the sonic log to age and composition
calculate acoustic impedance. The subject is briefly described The compaction of shales with burial is a well-known
in Chapter 8 (see ‘Seismic applications of the sonic log’). phenomenon and it can be followed on the density log.
Shale compaction involves a series of textural and com-
positional changes, resulting in a progressive increase
9.6 Qualitative uses
in density (e.g. Burst, 1969). For example shallow,
The density tool gives a continuous log of the formation’s uncompacted clays have densities around 2.0g/cm?, while
bulk density and it needs no interpretation as the character at depth, this figure commonly rises to 2.6g/cm?.
is given directly. The qualitative use of this Jog therefore Changes due to compaction are gradual and, when
depends on the geological significance of the density of seen in one well, occur over a considerable thickness of
a formation. sediment (Figure 9.12). To see clay compaction changes,
unless the shale series is very homogeneous, the density
Lithology identification
log should be re-plotted at a small vertical scale (say
The densities of the more common lithologies are rarely
1:5000). This method allows clay compaction to be
diagnostic since there is too much overlap and too much
examined even in shale-sand or shale-lime sequences.
spread caused by differences in composition and texture.
Shales, for example, may have densities ranging from Shale age and unconformities
1.8g/cm? to 2.7 g/cm*: the density difference between a Although it is by no means diagnostic, shale density is
plastic clay and a compacted shale (Table 9.5). Overall, often indicative of age. In general, older shales are more
oilfield densities generally measure between 2.0g/cm? dense. Palaeozoic clays are rare, as are Tertiary shales.
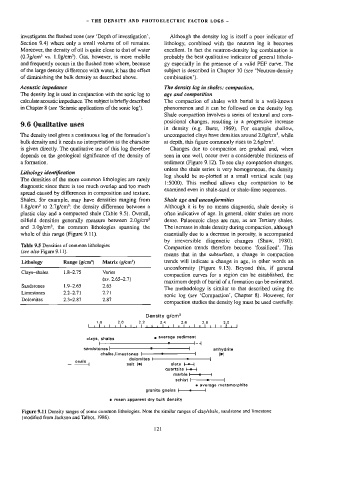
and 3.0g/cm’, the common lithologies spanning the The increase in shale density during compaction, although
whole of this range (Figure 9.11). essentially due to a decrease in porosity, is accompanied
by irreversible diagenetic changes (Shaw, 1980).
Table 9.5 Densities of common lithologies
Compaction trends therefore become ‘fossilized’. This
(see also Figure 9.11).
means that in the subsurface, a change in compaction
Lithology Range (g/cm?) Matrix (g/cm?) trends will indicate a change in age, in other words an
; unconformity (Figure 9.13). Beyond this, if general
Clays—shales Le Varies compaction curves for a region can be established, the
fav. 2.65-2.7) maximum depth of burial of a formation can be estimated.
Sandstones 1.9-2.65 2.65 The methodology is similar to that described using the
Limestones ainle ade sonic log (see ‘Compaction’, Chapter 8). However, for
Dotomutes oo 281 ae? compaction studies the density log must be used carefully.
Density g/cm?
1.8 2.0 2.2 2.4 2.6 2.8 3.0
bLaetit itis ty } pty ta tat ta tt
@ average sediment
clays, shales
L
> |
sandstones | * 1 anhydrite
chalks, limestones, /}——*—___$ le
dolomites /———»_
coals
—- ——1 salt }H slate e+
quartzite -+e—}
marbla -—e——+]
schist }———*—-—_+]
® average metamorphite
granite gneiss /}——*#——
@ mean apparent dry bulk density
Figure 9.11 Density ranges of some common lithologies. Note the similar ranges of clay/shale, sandstone and limestone
(modified from Jackson and Talbot, 1986).
121