
Page 141 - The Geological Interpretation of Well Logs
P. 141
- THE DENSITY AND PHOTOELECTRIC FACTOR LOGS -
1.9
0 GAMMA RAY
100 LITHOLOGY
PEF (Barns/electron)
CALIPER &
19 12 14016 924 6 8 16 20 2.0 + g
Om L
2.14
10m J bi & Q ”
20m 2.24 © c
5 2
= a
s
2-374
«a
&
E
cTS®
30m4
%
PF o«4 ° 3
£
&
2
a
s
cd
40m c qa °C ¢ a s
= = >
2 2.57 - a
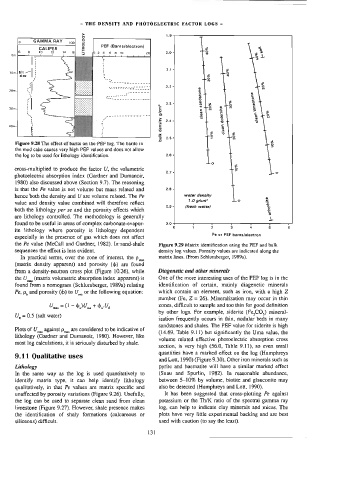
Figure 9.28 The effect of barite on the PEF log. The barite in
the mud cake causes very high PEF values and does not allow
the log to be used for lithology identification. 2.64
o
z
cross-multiplied to produce the factor U, the volumetric o
2.7 4 ~
photoelectric absorption index (Gardner and Dumanoir,
1980) also discussed above (Section 9.7). The reasoning
is that the Pe value is not volume but mass related and 2.8 4
hence both the density and U/ are volume related, The Pe water density °
1.0 gfer ° &
value and density value combined will therefore reflect
2.9 4 {fresh water} :
both the lithology per se and the porosity effects which
%
are lithology controlled. The methodology is generally
ae
3.0
T
T
T
T
T
T
found to be useful in areas of complex carbonate-evapor-
Q 1 2 3 4 5 6
ite lithology where porosity is lithology dependent
Pe or PEF barns/electron
especially in the presence of gas which does not affect
the Pe value (McCall and Gardner, 1982). In-sand-shale Figure 9.29 Matrix identification using the PEF and bulk
sequences the effect is less evident. density Jog values. Porosity values are indicated along the
In practical terms, over the zone of interest, the p,.., matrix lines. (From Schlumberger, 1989a).
(matrix density apparent) and porosity () are found
from a density-neutron cross plot (Figure 10,26), while Diagenetic and other minerais
the U__, (matrix volumetric absorption index .apparent) is One of the more interesting uses of the PEF log is in the
found from a nomogram (Schlumberger, 1989a) relating identification of certain, mainly diagenetic minerals
Pe, p, and porosity () to U_,, or the following equation: which contain an element, such as iron, with a high Z
number (Fe, Z = 26). Mineralization may occur in thin
zones, difficult to sample and too thin for good definition
Una = (dl -o)U,, + b,-U,
by other logs. For example, siderite (Fe,CO,) mineral-
U, = 0.5 (salt water)
ization frequently occurs in thin, nodular beds in many
sandstones and shales. The PEF value for siderite is high
Plots of U_,, against p,_,, are considered to be indicative of
(14.69, Table 9.11) but significantly the Uma value, the
lithology (Gardner and Dumanouwr, 1980). However, like
volume related effective photoelectric absorption cross
most log calculations, it is seriously disturbed by shale.
section, is very high (56.0, Table 9.11), so even small
quantities have a marked effect on the log (Humphreys
9.11 Qualitative uses
and Lott, 1990) (Figure 9.30), Other iron minerals such as
Lithology pyrite and haematite will have a similar marked effect
In the same way as the log is used quantitatively to (Suau and Spurlin, 1982). In reasonable abundance,
identify matrix type, it can help identify lithology between 5—10% by volume, biotite and glauconite may
qualitatively, in that Pe values are matrix specific and also be detected (Humphreys and Lott, 1990).
unaffected by porosity variations (Figure 9.26). Usefully, It has been suggested that cross-plotting Pe against
the log can be used to separate clean sand from clean potassium or the Th/K ratio of the spectral gamma ray
limestone (Figure 9.27). However, shale presence makes log, can help to indicate clay minerals and micas. The
the identification of shaly formations (calcareous or plots have very tittle experimental backing and are best
siliceous) difficult. used with caution (to say the least).
131