
Page 269 - The Handbook for Quality Management a Complete Guide to Operational Excellence
P. 269
256 C o n t i n u o u s I m p r o v e m e n t e f f e c t i v e C h a n g e M a n a g e m e n t 257
prioritizing these opportunities. The PPI is calculated as follows (Juran
and Gryna, 1993):
×
savings probability of success
PPI =
l
c ost × completion time
The inputs are, of course, estimates and the result is totally dependent
on the accuracy of the inputs. The resulting number is an index value for a
given project. The PPI values allow comparison of various projects; they
have no intrinsic meaning in and of themselves. If there are clear standouts,
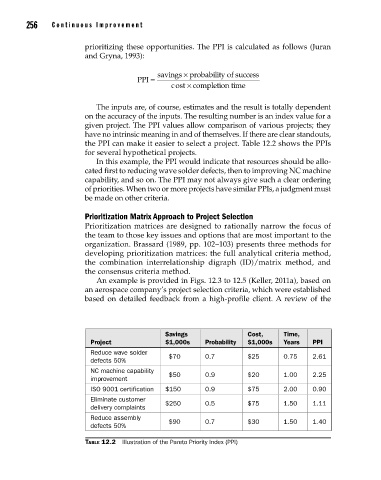
the PPI can make it easier to select a project. Table 12.2 shows the PPIs
for several hypothetical projects.
In this example, the PPI would indicate that resources should be allo-
cated first to reducing wave solder defects, then to improving NC machine
capability, and so on. The PPI may not always give such a clear ordering
of priorities. When two or more projects have similar PPIs, a judgment must
be made on other criteria.
Prioritization Matrix Approach to Project Selection
Prioritization matrices are designed to rationally narrow the focus of
the team to those key issues and options that are most important to the
organization. Brassard (1989, pp. 102–103) presents three methods for
developing prioritization matrices: the full analytical criteria method,
the combination interrelationship digraph (ID)/matrix method, and
the consensus criteria method.
An example is provided in Figs. 12.3 to 12.5 (Keller, 2011a), based on
an aerospace company’s project selection criteria, which were established
based on detailed feedback from a high-profile client. A review of the
Savings Cost, Time,
Project $1,000s Probabi lity $1,000s Years PPI
Reduce wave solder
defects 50% $70 0.7 $25 0.75 2.61
NC machine capability $50 0.9 $20 1.00 2.25
improvement
ISO 9001 certification $150 0.9 $75 2.00 0.90
Eliminate customer $250 0.5 $75 1.50 1.11
delivery complaints
Reduce assembly
defects 50% $90 0.7 $30 1.50 1.40
Table 12.2 Illustration of the Pareto Priority Index (PPI)
12_Pyzdek_Ch12_p241-264.indd 256 11/9/12 5:13 PM