Page 271 - The Handbook for Quality Management a Complete Guide to Operational Excellence
P. 271

258    C o n t i n u o u s   I m p r o v e m e n t                                                                                                              e f f e c t i v e   C h a n g e   M a n a g e m e n t    259


                                within  the  team  on  how  well  each  project  option  met  the  criteria.  The
                                options rating matrix for the benefit/cost ratio criteria is shown in Fig. 12.4.
                                Note that there will be an options matrix for each criterion, so eight option
                                matrices in this case.
                                   A summary matrix can then be constructed by applying the criteria
                                weights (shown in Fig. 12.3) to each of the eight option matrices. The sum-
                                mary matrix for the example, shown in Fig. 12.5, indicates that the best
                                overall benefit relative to the weighted criteria is provided by the ECO
                                Cycle Time Reduction project.
                                   When  criteria  have  equal  weight,  a  simpler  matrix  diagram  can  be
                                used to directly compare each option with each criteria. The analytical
                                hierarchy process, also known as the full analytical method, is more time-
                                consuming but allows a team to develop consensus on the criteria impor-
                                tance  and  the  relative  benefits  of  each  project  as  it  moves  through  the
                                generation of each score in each cell of each matrix.
                                Project Selection Using Constraint Theory
                                Another  approach  for  project  selection  uses  the  theory  of  constraints
                                (TOC), discussed in Chap. 5. Pyzdek and Keller (2010) provide the follow-
                                ing approach (used by permission), based on Goldratt’s methods for con-
                                straint management (1990):
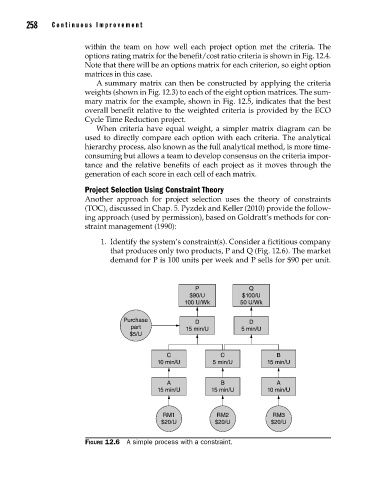
                                    1.  Identify the system’s constraint(s). Consider a fictitious company
                                       that produces only two products, P and Q (Fig. 12.6). The market
                                       demand for P is 100 units per week and P sells for $90 per unit.


                                                              P              Q
                                                            $90/U          $100/U
                                                           100 U/Wk       50 U/Wk

                                          Purchase            D              D
                                            part           15 min/U        5 min/U
                                            $5/U


                                                      C              C              B
                                                    10 min/U       5 min/U        15 min/U


                                                      A              B              A
                                                    15 min/U      15 min/U        10 min/U


                                                     RM1            RM2            RM3
                                                     $20/U         $20/U           $20/U


                                Figure 12.6  A simple process with a constraint.


          12_Pyzdek_Ch12_p241-264.indd   258                                                            11/9/12   5:13 PM
   266   267   268   269   270   271   272   273   274   275   276