
Page 344 - The Handbook for Quality Management a Complete Guide to Operational Excellence
P. 344
330 C o n t i n u o u s I m p r o v e m e n t A n a l y z e S t a g e 331
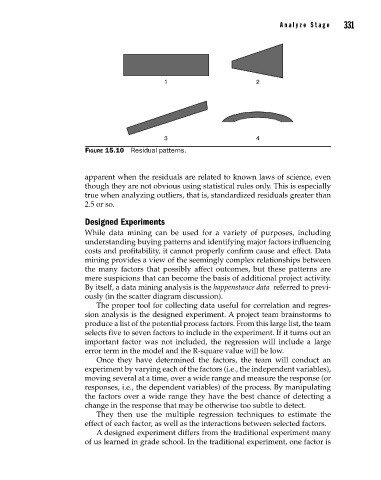
Figure 15.10 Residual patterns.
apparent when the residuals are related to known laws of science, even
though they are not obvious using statistical rules only. This is especially
true when analyzing outliers, that is, standardized residuals greater than
2.5 or so.
Designed Experiments
While data mining can be used for a variety of purposes, including
understanding buying patterns and identifying major factors influencing
costs and profitability, it cannot properly confirm cause and effect. Data
mining provides a view of the seemingly complex relationships between
the many factors that possibly affect outcomes, but these patterns are
mere suspicions that can become the basis of additional project activity.
By itself, a data mining analysis is the happenstance data referred to previ-
ously (in the scatter diagram discussion).
The proper tool for collecting data useful for correlation and regres-
sion analysis is the designed experiment. A project team brainstorms to
produce a list of the potential process factors. From this large list, the team
selects five to seven factors to include in the experiment. If it turns out an
important factor was not included, the regression will include a large
error term in the model and the R-square value will be low.
Once they have determined the factors, the team will conduct an
experiment by varying each of the factors (i.e., the independent variables),
moving several at a time, over a wide range and measure the response (or
responses, i.e., the dependent variables) of the process. By manipulating
the factors over a wide range they have the best chance of detecting a
change in the response that may be otherwise too subtle to detect.
They then use the multiple regression techniques to estimate the
effect of each factor, as well as the interactions between selected factors.
A designed experiment differs from the traditional experiment many
of us learned in grade school. In the traditional experiment, one factor is
15_Pyzdek_Ch15_p305-334.indd 331 11/20/12 10:33 PM