
Page 346 - The Handbook for Quality Management a Complete Guide to Operational Excellence
P. 346
332 C o n t i n u o u s I m p r o v e m e n t A n a l y z e S t a g e 333
Customer satisfaction scores
Personal response vs. cycle time interaction
Cycle time
37.0 330.000
Satisfaction score means 29.0 210.000
33.0
25.0
21.0
No Yes
Personal response
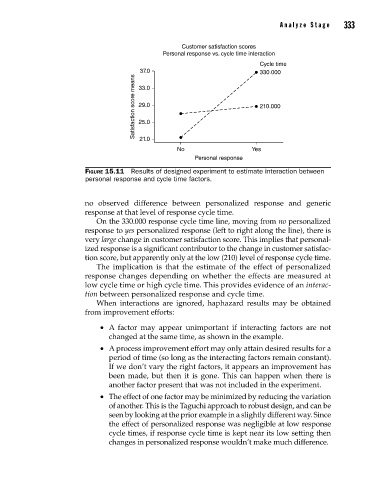
Figure 15.11 Results of designed experiment to estimate interaction between
personal response and cycle time factors.
no observed difference between personalized response and generic
response at that level of response cycle time.
On the 330.000 response cycle time line, moving from no personalized
response to yes personalized response (left to right along the line), there is
very large change in customer satisfaction score. This implies that personal-
ized response is a significant contributor to the change in customer satisfac-
tion score, but apparently only at the low (210) level of response cycle time.
The implication is that the estimate of the effect of personalized
response changes depending on whether the effects are measured at
low cycle time or high cycle time. This provides evidence of an interac-
tion between personalized response and cycle time.
When interactions are ignored, haphazard results may be obtained
from improvement efforts:
• A factor may appear unimportant if interacting factors are not
changed at the same time, as shown in the example.
• A process improvement effort may only attain desired results for a
period of time (so long as the interacting factors remain constant).
If we don’t vary the right factors, it appears an improvement has
been made, but then it is gone. This can happen when there is
another factor present that was not included in the experiment.
• The effect of one factor may be minimized by reducing the variation
of another. This is the Taguchi approach to robust design, and can be
seen by looking at the prior example in a slightly different way. Since
the effect of personalized response was negligible at low response
cycle times, if response cycle time is kept near its low setting then
changes in personalized response wouldn’t make much difference.
15_Pyzdek_Ch15_p305-334.indd 333 11/20/12 10:33 PM