
Page 345 - The Handbook for Quality Management a Complete Guide to Operational Excellence
P. 345
332 C o n t i n u o u s I m p r o v e m e n t A n a l y z e S t a g e 333
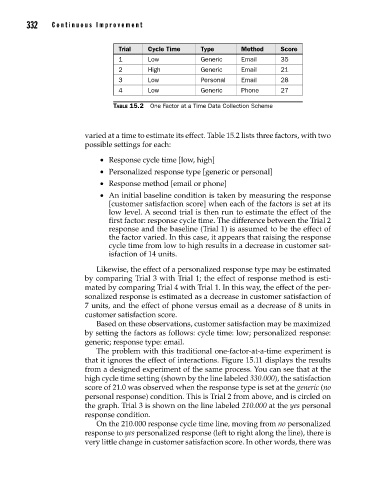
Trial Cycle Time Type Method Score
1 Low Generic Email 35
2 High Generic Email 21
3 Low Personal Email 28
4 Low Generic Phone 27
Table 15.2 One Factor at a Time Data Collection Scheme
varied at a time to estimate its effect. Table 15.2 lists three factors, with two
possible settings for each:
• Response cycle time [low, high]
• Personalized response type [generic or personal]
• Response method [email or phone]
• An initial baseline condition is taken by measuring the response
[customer satisfaction score] when each of the factors is set at its
low level. A second trial is then run to estimate the effect of the
first factor: response cycle time. The difference between the Trial 2
response and the baseline (Trial 1) is assumed to be the effect of
the factor varied. In this case, it appears that raising the response
cycle time from low to high results in a decrease in customer sat-
isfaction of 14 units.
Likewise, the effect of a personalized response type may be estimated
by comparing Trial 3 with Trial 1; the effect of response method is esti-
mated by comparing Trial 4 with Trial 1. In this way, the effect of the per-
sonalized response is estimated as a decrease in customer satisfaction of
7 units, and the effect of phone versus email as a decrease of 8 units in
customer satisfaction score.
Based on these observations, customer satisfaction may be maximized
by setting the factors as follows: cycle time: low; personalized response:
generic; response type: email.
The problem with this traditional one-factor-at-a-time experiment is
that it ignores the effect of interactions. Figure 15.11 displays the results
from a designed experiment of the same process. You can see that at the
high cycle time setting (shown by the line labeled 330.000), the satisfaction
score of 21.0 was observed when the response type is set at the generic (no
personal response) condition. This is Trial 2 from above, and is circled on
the graph. Trial 3 is shown on the line labeled 210.000 at the yes personal
response condition.
On the 210.000 response cycle time line, moving from no personalized
response to yes personalized response (left to right along the line), there is
very little change in customer satisfaction score. In other words, there was
15_Pyzdek_Ch15_p305-334.indd 332 11/20/12 10:33 PM