
Page 341 - The Handbook for Quality Management a Complete Guide to Operational Excellence
P. 341
328 C o n t i n u o u s I m p r o v e m e n t A n a l y z e S t a g e 329
The mathe matical model for multiple linear regression has additional terms
for the addi tional independent variables, for example:
y = b + b x + b x + e
0
1 1
2 2
where y is the dependent variable, x and x are independent variables, b 0
1
2
is the intercept, b is the coefficient for x ,b is the coefficient for x , and e is
2
1 2
1
the error. More variables can be added to the model as needed.
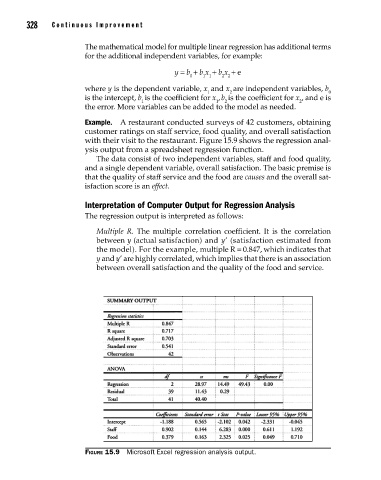
Example. A restaurant conducted surveys of 42 customers, obtaining
customer rat ings on staff service, food quality, and overall satisfaction
with their visit to the restaurant. Figure 15.9 shows the regression anal-
ysis output from a spread sheet regression function.
The data consist of two independent variables, staff and food quality,
and a single dependent variable, overall satisfaction. The basic premise is
that the qual ity of staff service and the food are causes and the overall sat-
isfaction score is an effect.
Interpretation of Computer Output for Regression Analysis
The regression output is interpreted as follows:
Multiple R. The multiple correlation coefficient. It is the correlation
between y (actual satisfaction) and y’ (satisfaction estimated from
the model). For the example, multiple R = 0.847, which indicates that
y and y’ are highly correlated, which implies that there is an association
between overall satisfaction and the quality of the food and service.
Figure 15.9 Microsoft Excel regression analysis output.
15_Pyzdek_Ch15_p305-334.indd 328 11/20/12 10:33 PM