
Page 336 - The Handbook for Quality Management a Complete Guide to Operational Excellence
P. 336
322 C o n t i n u o u s I m p r o v e m e n t A n a l y z e S t a g e 323
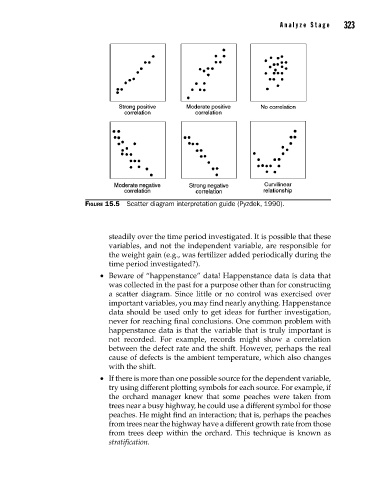
Figure 15.5 Scatter diagram interpretation guide (Pyzdek, 1990).
steadily over the time period investigated. It is possible that these
variables, and not the independent variable, are responsible for
the weight gain (e.g., was fertilizer added periodically during the
time period investigated?).
• Beware of “happenstance” data! Happenstance data is data that
was collected in the past for a purpose other than for constructing
a scatter diagram. Since little or no control was exercised over
important variables, you may find nearly anything. Happenstance
data should be used only to get ideas for further investigation,
never for reaching final conclusions. One common problem with
happenstance data is that the variable that is truly important is
not recorded. For example, records might show a correlation
between the defect rate and the shift. However, perhaps the real
cause of defects is the ambient temperature, which also changes
with the shift.
• If there is more than one possible source for the dependent variable,
try using different plotting symbols for each source. For example, if
the orchard manager knew that some peaches were taken from
trees near a busy highway, he could use a different symbol for those
peaches. He might find an interaction; that is, perhaps the peaches
from trees near the highway have a different growth rate from those
from trees deep within the orchard. This technique is known as
stratification.
15_Pyzdek_Ch15_p305-334.indd 323 11/20/12 10:33 PM