
Page 339 - The Handbook for Quality Management a Complete Guide to Operational Excellence
P. 339
326 C o n t i n u o u s I m p r o v e m e n t A n a l y z e S t a g e 327
12 10
I II
10 8
8 6
6 4
3 2
3 6 9 12 15 3 6 9 12 15
15 15
III IV
12 12
9 9
6 6
3 3
3 6 9 12 15 5 10 15 20
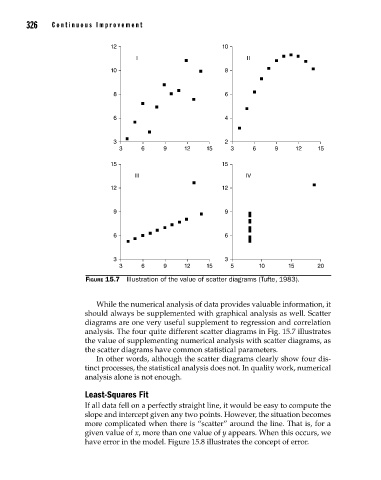
Figure 15.7 Illustration of the value of scatter diagrams (Tufte, 1983).
While the numerical analysis of data provides valuable information, it
should always be supplemented with graphical analysis as well. Scatter
dia grams are one very useful supplement to regression and correlation
analysis. The four quite different scatter diagrams in Fig. 15.7 illustrates
the value of supplementing numerical analysis with scatter diagrams, as
the scatter diagrams have common statistical parameters.
In other words, although the scatter diagrams clearly show four dis-
tinct processes, the statistical analysis does not. In quality work, numerical
analysis alone is not enough.
Least-Squares Fit
If all data fell on a perfectly straight line, it would be easy to compute the
slope and intercept given any two points. However, the situation becomes
more complicated when there is “scatter” around the line. That is, for a
given value of x, more than one value of y appears. When this occurs, we
have error in the model. Figure 15.8 illustrates the concept of error.
15_Pyzdek_Ch15_p305-334.indd 326 11/20/12 10:33 PM