
Page 335 - The Handbook for Quality Management a Complete Guide to Operational Excellence
P. 335
322 C o n t i n u o u s I m p r o v e m e n t A n a l y z e S t a g e 323
Data ID Days on Tree Weight (ounces)
1 75 4.5
2 76 4.5
3 77 4.4
4 78 4.6
5 79 5.0
6 80 4.8
7 80 4.9
8 81 5.1
9 82 5.2
10 82 5.2
11 83 5.5
12 84 5.4
13 85 5.5
14 85 5.5
15 86 5.6
16 87 5.7
17 88 5.8
18 89 5.8
19 90 6.0
20 90 6.1
(Pyzdek, 1990)
Table 15.1 Raw Data for Scatter Diagram
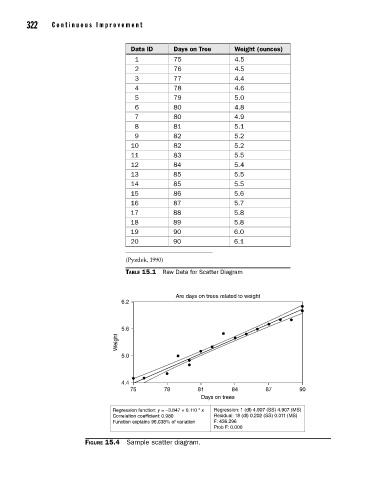
Are days on trees related to weight
6.2
5.6
Weight
5.0
4.4
75 78 81 84 87 90
Days on trees
Regression function: y = –3.847 + 0.110 * x Regression: 1 (df) 4.907 (SS) 4.907 (MS)
Correlation coefficient: 0.980 Residual: 18 (df) 0.202 (SS) 0.011 (MS)
Function explains 96.038% of variation F: 436.296
Prob F: 0.000
Figure 15.4 Sample scatter diagram.
15_Pyzdek_Ch15_p305-334.indd 322 11/20/12 10:33 PM