
Page 338 - The Handbook for Quality Management a Complete Guide to Operational Excellence
P. 338
324 C o n t i n u o u s I m p r o v e m e n t A n a l y z e S t a g e 325
12
10
8
Y 6
4
2
0
0 1 2 3 4
X
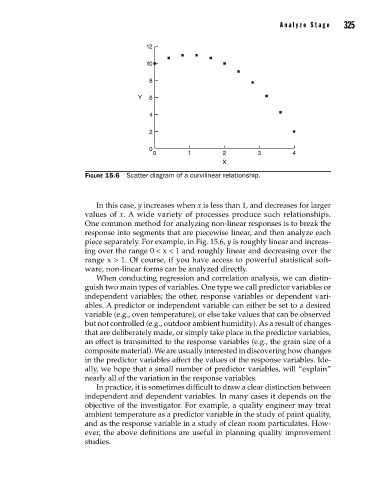
Figure 15.6 Scatter diagram of a curvilinear relationship.
In this case, y increases when x is less than 1, and decreases for larger
values of x. A wide variety of processes produce such relationships.
One common method for analyzing non-linear responses is to break the
response into segments that are piecewise linear, and then analyze each
piece separately. For example, in Fig. 15.6, y is roughly linear and increas-
ing over the range 0 < x < 1 and roughly linear and decreasing over the
range x > 1. Of course, if you have access to powerful statistical soft-
ware, non-linear forms can be analyzed directly.
When conducting regression and correlation analysis, we can distin-
guish two main types of variables. One type we call predictor variables or
independent variables; the other, response variables or dependent vari-
ables. A predictor or independent variable can either be set to a desired
variable (e.g., oven temperature), or else take values that can be observed
but not controlled (e.g., outdoor ambient humidity). As a result of changes
that are deliberately made, or simply take place in the predictor variables,
an effect is transmitted to the response variables (e.g., the grain size of a
composite material). We are usually interested in discovering how changes
in the predictor variables affect the values of the response variables. Ide-
ally, we hope that a small number of predictor variables, will “explain”
nearly all of the variation in the response variables.
In practice, it is sometimes difficult to draw a clear distinction between
independent and dependent variables. In many cases it depends on the
objec tive of the investigator. For example, a quality engineer may treat
ambient temperature as a predictor variable in the study of paint quality,
and as the response variable in a study of clean room particulates. How-
ever, the above definitions are useful in planning quality improvement
studies.
15_Pyzdek_Ch15_p305-334.indd 325 11/20/12 10:33 PM