Page 185 - The Six Sigma Project Planner
P. 185

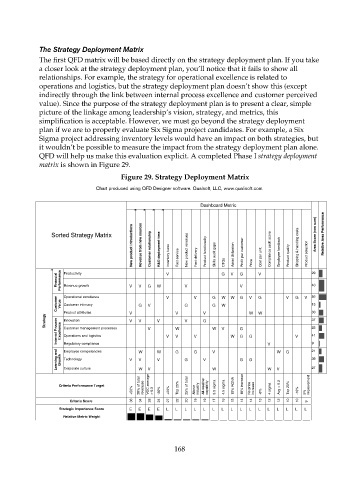
The Strategy Deployment Matrix
                    The first QFD matrix will be based directly on the strategy deployment plan. If you take
                    a closer look at the strategy deployment plan, you’ll notice that it fails to show all
                    relationships. For example, the strategy for operational excellence is related to
                    operations and logistics, but the strategy deployment plan doesn’t show this (except
                    indirectly through the link between internal process excellence and customer perceived
                    value). Since the purpose of the strategy deployment plan is to present a clear, simple
                    picture of the linkage among leadership’s vision, strategy, and metrics, this
                    simplification is acceptable. However, we must go beyond the strategy deployment
                    plan if we are to properly evaluate Six Sigma project candidates. For example, a Six
                    Sigma project addressing inventory levels would have an impact on both strategies, but
                    it wouldn’t be possible to measure the impact from the strategy deployment plan alone.
                    QFD will help us make this evaluation explicit. A completed Phase I  strategy deployment
                    matrix is shown in Figure 29.
                                             Figure 29. Strategy Deployment Matrix
                                     Chart produced using QFD Designer software. Qualsoft, LLC, www.qualisoft.com.


                                                                    Dashboard Metric


                                                New product introductions  Revenue from new sources  Customer relationship  R&D deployment time  Inventory turns  Fast service  New product revenues  Fast delivery  Product functionality  Skills audit gaps  CTQs  Asset Utilization  Profit per customer  Cost per unit  Compliance audit score  Employee feedback  Product quality  Shipping & handling costs  Product selection
                        Sorted Strategy Matrix                                                         Area Score (row sum)  Relative Area Performance


                         Financial   Performance  Productivity  V  V  G  W  V  V  G  V  G  Price  V   29

                                                                                                      40
                           Revenue growth
                                                                                V
                         Customer   Value  Operational excellence  G  V  V  G  V  G  W  W  G  V  G  V  G  V  55
                                                                                                      15
                           Customer intimacy
                                                                           W
                                                                        G
                      Strategy  Product attributes  V V  V  V  V  V  V G           W  W               33
                         Internal Process   Excellence Innovation  V  V  W  V  W  V  W  G  G  V  V    25
                                                                                                      37
                           Customer management processes
                                                                                                      41
                                                             V
                           Operations and logistics
                                                                                G
                           Regulatory compliance
                                                                                                      9
                         Learning and   Growth  Employee competencies  V  W  V  W  G  G  G  V  V W  G  G  W  W  G  21
                                                                                                      39
                           Technology
                                                  V
                                                       V
                                                                                                      27
                                                  W
                                                                                           V
                           Corporate culture
                          Criteria Performance Target  20% of total   revenues  VOC average   Top 25%  25% of total  All-weather   capability  3.5 sigma  4.5 sigma  15% RONA  10% increase  No price   Avg > 6.2  Top 20%  improvement
                                                +50%  > 6.5  -30%  +20%  Above   industry   increase  -6%  4 sigma  -10%  5%
                             Criteria Score     36  34  28  24  27  22  20  19  19  17  16  15  14  14  13  12  12  10  10  9
                          Strategic Importance Score  E  E  E  E  L  L  L  L  L  L  L  L  L  L  L  L  L  L  L  L
                           Relative Metric Weight
                                                             168
   180   181   182   183   184   185   186   187   188   189   190