Page 188 - The Six Sigma Project Planner
P. 188

Deploying Differentiators to Operations
                    QFD most often fails because the matrices grow until the analysis becomes
                    burdensome. As the matrix grows like Topsy and becomes unwieldy, the team
                    performing QFD begins to sense the lack of focus being documented by the QFD
                    matrix. Soon, interest begins to wane and eventually the effort grinds to a halt. This too
                    is avoided by eliminating ✔ key requirements from the strategy deployment matrix. We
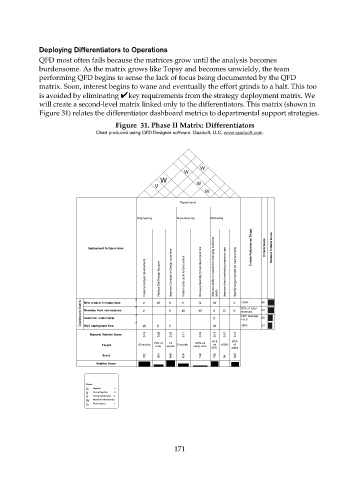
                    will create a second-level matrix linked only to the differentiators. This matrix (shown in
                    Figure 31) relates the differentiator dashboard metrics to departmental support strategies.
                                           Figure  31. Phase II Matrix: Differentiators
                                     Chart produced using QFD Designer software. Qualsoft, LLC, www.qualisoft.com.


                                                                    W W
                                                                W W
                                                        W W
                                                       V V         W W
                                                                      W W
                                                              Departments

                                                 Engineering  Manufacturing  Marketing


                                   Deployment to Operations                         Criteria Performance Target  Criteria Score  Relative Criteria Score
                                                     Faster prototype development   Reduce Old Design Support    Improve Concept-to-Design cycle time   Faster ramp-up to full production   Increase flexibility to handle product mix   Improve ability to respond to changing customer   needs   Improve direct marketing response rate   Identify target markets for new products


                                 Dashboard Metric  New product introductions  V V  W  V V  V W  G W  W  G  V V  +50%  36 34 28
                                                                                 20% of total
                                                                        V
                                 Revenue from new sources
                                                                                 revenues
                                                                                 VOC average
                                 Customer relationship
                                                                        V
                                                                                 > 6.5
                                 R&D deployment time
                                   Numeric Relative Score  W 0.18  V 0.08  V 0.22  0.11  0.04  W 0.19  0.01  0.16  -30%  24
                                                                        +0.5   20%
                                                      15% of   12   -50% on
                                       Target     10 weeks   6 weeks    on   +50%  of
                                                       time  weeks  setup time
                                                                        VOC   sales
                                       Score        702  324  846  426  138  738  34  630
                                     Relative Score
                                  File:
                                  Date:  12/30/1899 0:00
                                  Weight
                                  R  Negative  -1
                                  S  Strong Negative  -3
                                  V  Strong Relationship  9
                                  W  Moderate Relationship 3
                                  G  Weak Symbol  1

                                                             171
   183   184   185   186   187   188   189   190   191   192   193