
Page 190 - The Six Sigma Project Planner
P. 190
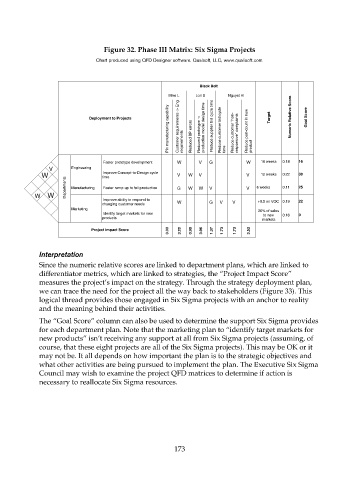
Figure 32. Phase III Matrix: Six Sigma Projects
                                     Chart produced using QFD Designer software. Qualsoft, LLC, www.qualisoft.com.


                                                                    Black Belt
                                                           Mike L  Lori S    Nguyet H
                                                           Pin manufacturing capability  Customer requirements -> Eng  requirements  Reduced BP errors  Reduced prototype ->  production model design time   Reduce supplier bid cycle time  Reduce customer bid cycle   Reduce customer "non- responsive" complaints  Reduce part-count in new
                                   Deployment to Projects                                Target  Numeric Relative Score  Goal Score


                                        Faster prototype development  W  V  G  time  W product  10 weeks  0.18  16
                       V V    Engineering
                     W W                Improve Concept-to-Design cycle   V  W  V  V   12 weeks  0.22  30
                                       time
                            Departments  Manufacturing   Faster ramp-up to full production  G  W  W  V  V  6 weeks  0.11  25
                   W W  W W
                                        Improve ability to respond to                 +0.5 on VOC 0.19  22
                                       changing customer needs  W      G  V   V
                              Marketing                                               20% of sales
                                        Identify target markets for new                to new   0.16  0
                                       products                                        markets
                                                           0.00  3.22  0.99  3.96  1.37  1.73  1.73  3.53
                                    Project Impact Score


                    Interpretation
                    Since the numeric relative scores are linked to department plans, which are linked to
                    differentiator metrics, which are linked to strategies, the “Project Impact Score”
                    measures the project’s impact on the strategy. Through the strategy deployment plan,
                    we can trace the need for the project all the way back to stakeholders (Figure 33). This
                    logical thread provides those engaged in Six Sigma projects with an anchor to reality
                    and the meaning behind their activities.
                    The “Goal Score” column can also be used to determine the support Six Sigma provides
                    for each department plan. Note that the marketing plan to “identify target markets for
                    new products” isn’t receiving any support at all from Six Sigma projects (assuming, of
                    course, that these eight projects are all of the Six Sigma projects). This may be OK or it
                    may not be. It all depends on how important the plan is to the strategic objectives and
                    what other activities are being pursued to implement the plan. The Executive Six Sigma
                    Council may wish to examine the project QFD matrices to determine if action is
                    necessary to reallocate Six Sigma resources.


                                                             173