
Page 359 - The Toyota Way Fieldbook
P. 359
334 THE TOYOTA WAY FIELDBOOK
Therefore: The line stops.
The robot breaks down. Start with the perceived problem and work up to
find the true problem.
Once the true problem and resulting symptoms are identified, it’s possible
to compare the full implications of the true problem and consider the value of
proceeding with the process of solving the problem. It is still necessary to define
the extent of the problem and its characteristics.
Defining the Problem
In order to be defined as a “problem,” four pieces of information are required:
1. The actual current performance with some historical trend detail.
2. The desired performance (standard or goal).
3. The magnitude of the problem as seen by the difference between the actual
and desired (sometimes referred to as the “gap”).
4. The extent and characteristics of the problem or situation.
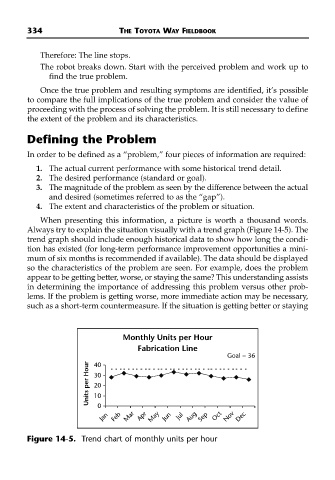
When presenting this information, a picture is worth a thousand words.
Always try to explain the situation visually with a trend graph (Figure 14-5). The
trend graph should include enough historical data to show how long the condi-
tion has existed (for long-term performance improvement opportunities a mini-
mum of six months is recommended if available). The data should be displayed
so the characteristics of the problem are seen. For example, does the problem
appear to be getting better, worse, or staying the same? This understanding assists
in determining the importance of addressing this problem versus other prob-
lems. If the problem is getting worse, more immediate action may be necessary,
such as a short-term countermeasure. If the situation is getting better or staying
Monthly Units per Hour
Fabrication Line
Goal = 36
Units per Hour 30
40
20
10
0
Jan Feb Mar Apr May Jun Jul Aug Sep Oct Nov Dec
Figure 14-5. Trend chart of monthly units per hour