
Page 362 - The Toyota Way Fieldbook
P. 362
Chapter 14. Develop a Thorough Understanding 337
Fabrication Daily Units per Hour
140
120
Units per Hour 80 Goal = 36
100
60
40
20
0
1 2 3 4 5 8 9 10 11 12 15 16
Date
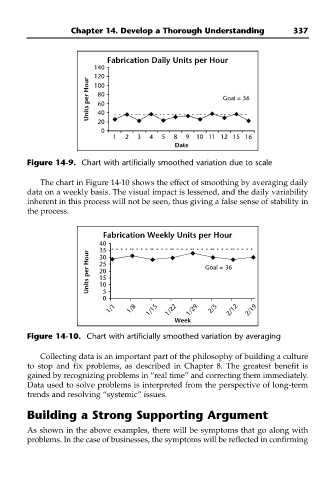
Figure 14-9. Chart with artificially smoothed variation due to scale
The chart in Figure 14-10 shows the effect of smoothing by averaging daily
data on a weekly basis. The visual impact is lessened, and the daily variability
inherent in this process will not be seen, thus giving a false sense of stability in
the process.
Fabrication Weekly Units per Hour
40
35
Units per Hour 30 Goal = 36
25
20
15
10
5
0
1/1 1/8 1/15 1/22 1/29 2/5 2/12 2/19
Week
Figure 14-10. Chart with artificially smoothed variation by averaging
Collecting data is an important part of the philosophy of building a culture
to stop and fix problems, as described in Chapter 8. The greatest benefit is
gained by recognizing problems in “real time” and correcting them immediately.
Data used to solve problems is interpreted from the perspective of long-term
trends and resolving “systemic” issues.
Building a Strong Supporting Argument
As shown in the above examples, there will be symptoms that go along with
problems. In the case of businesses, the symptoms will be reflected in confirming