
Page 361 - The Toyota Way Fieldbook
P. 361
336 THE TOYOTA WAY FIELDBOOK
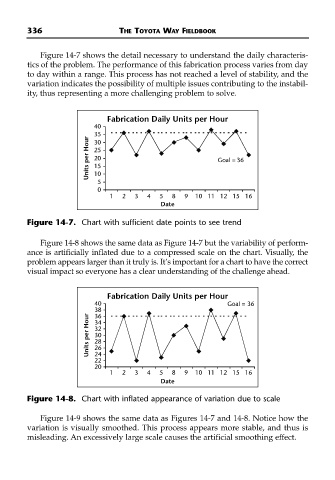
Figure 14-7 shows the detail necessary to understand the daily characteris-
tics of the problem. The performance of this fabrication process varies from day
to day within a range. This process has not reached a level of stability, and the
variation indicates the possibility of multiple issues contributing to the instabil-
ity, thus representing a more challenging problem to solve.
Fabrication Daily Units per Hour
40
35
Units per Hour 25 Goal = 36
30
20
15
10
5
0
1 2 3 4 5 8 9 10 11 12 15 16
Date
Figure 14-7. Chart with sufficient date points to see trend
Figure 14-8 shows the same data as Figure 14-7 but the variability of perform-
ance is artificially inflated due to a compressed scale on the chart. Visually, the
problem appears larger than it truly is. It’s important for a chart to have the correct
visual impact so everyone has a clear understanding of the challenge ahead.
Fabrication Daily Units per Hour
40 Goal = 36
38
Units per Hour 32
36
34
30
28
26
24
22
20
1 2 3 4 5 8 9 1011121516
Date
Figure 14-8. Chart with inflated appearance of variation due to scale
Figure 14-9 shows the same data as Figures 14-7 and 14-8. Notice how the
variation is visually smoothed. This process appears more stable, and thus is
misleading. An excessively large scale causes the artificial smoothing effect.