Page 447 - The Toyota Way Fieldbook
P. 447
Chapter 19. Lean Implementation Strategies and Tactics           417


                  S-Secondary
           P-Primary  Metric (s)          Original          Target Cell  1 Month  6 Months  9 Months
                                               State of
                                                                     Later
                                                            Later
                                                                                   Later
           P   Assembly Lead Time in minutes  46       13.75       12.8        11
               (SWIP x TT)
           P   Purchased Part Inventory ($)  48K       36.5K       30K        24.0K
           S   Continuous Flow or Pull      0%      80% Complete   90%        100%
           S   Square Footage              1896        1596        1446       1414
           S   Operators/Shift              7           6          5.6         4.5
           S   % Direct Labor Efficiency    61          98        101%        123%
           S   Parts Per Employee Hour      5.4         9         11.25       11.25
                                          Every part  Every part  Every part  Every part
           S   Changeover Frequency
                                          Every week  Every 2 days  Every 1 day  Every shift
           S   Overtime (Hrs/Wk)            252        100         20          10
           S   Non-conforming (% of total Prod.)  1.70%  0.70%    0.40%         -
           S   Changeover time (mins)       >60        <25         <15         <15

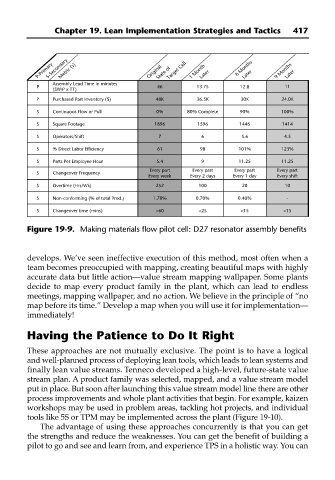
        Figure 19-9. Making materials flow pilot cell: D27 resonator assembly benefits


        develops. We’ve seen ineffective execution of this method, most often when a
        team becomes preoccupied with mapping, creating beautiful maps with highly
        accurate data but little action—value stream mapping wallpaper. Some plants
        decide to map every product family in the plant, which can lead to endless
        meetings, mapping wallpaper, and no action. We believe in the principle of “no
        map before its time.” Develop a map when you will use it for implementation—
        immediately!


        Having the Patience to Do It Right

        These approaches are not mutually exclusive. The point is to have a logical
        and well-planned process of deploying lean tools, which leads to lean systems and
        finally lean value streams. Tenneco developed a high-level, future-state value
        stream plan. A product family was selected, mapped, and a value stream model
        put in place. But soon after launching this value stream model line there are other
        process improvements and whole plant activities that begin. For example, kaizen
        workshops may be used in problem areas, tackling hot projects, and individual
        tools like 5S or TPM may be implemented across the plant (Figure 19-10).
            The advantage of using these approaches concurrently is that you can get
        the strengths and reduce the weaknesses. You can get the benefit of building a
        pilot to go and see and learn from, and experience TPS in a holistic way. You can

