
Page 350 - The Mechatronics Handbook
P. 350
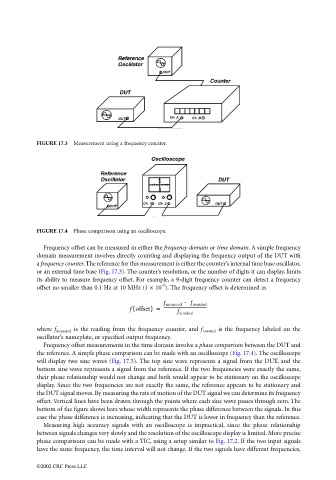
FIGURE 17.3  Measurement using a frequency counter.


                                 FIGURE 17.4  Phase comparison using an oscilloscope.

                                   Frequency offset can be measured in either the frequency domain or time domain. A simple frequency
                                 domain measurement involves directly counting and displaying the frequency output of the DUT with
                                 a frequency counter. The reference for this measurement is either the counter’s internal time base oscillator,
                                 or an external time base (Fig. 17.3). The counter’s resolution, or the number of digits it can display, limits
                                 its ability to measure frequency offset. For example, a 9-digit frequency counter can detect a frequency
                                                                       -8
                                 offset no smaller than 0.1 Hz at 10 MHz (1 × 10 ). The frequency offset is determined as
                                                                        f measured –  f nominal
                                                              (
                                                             f offset) =  --------------------------------------
                                                                            f nominal
                                 where  f measured  is the reading from the frequency counter, and  f nominal  is the frequency labeled on the
                                 oscillator’s nameplate, or specified output frequency.
                                   Frequency offset measurements in the time domain involve a   phase comparison  between the DUT and
                                 the reference. A simple phase comparison can be made with an oscilloscope (Fig. 17.4). The oscilloscope
                                 will display two sine waves (Fig. 17.5). The top sine wave represents a signal from the DUT, and the
                                 bottom sine wave represents a signal from the reference. If the two frequencies were exactly the same,
                                 their phase relationship would not change and both would appear to be stationary on the oscilloscope
                                 display. Since the two frequencies are not exactly the same, the reference appears to be stationary and
                                 the DUT signal moves. By measuring the rate of motion of the DUT signal we can determine its frequency
                                 offset. Vertical lines have been drawn through the points where each sine wave passes through zero. The
                                 bottom of the figure shows bars whose width represents the phase difference between the signals. In this
                                 case the phase difference is increasing, indicating that the DUT is lower in frequency than the reference.
                                   Measuring high accuracy signals with an oscilloscope is impractical, since the phase relationship
                                 between signals changes very slowly and the resolution of the oscilloscope display is limited. More precise
                                 phase comparisons can be made with a TIC, using a setup similar to Fig. 17.2. If the two input signals
                                 have the same frequency, the time interval will not change. If the two signals have different frequencies,

                                 ©2002 CRC Press LLC