
Page 351 - The Mechatronics Handbook
P. 351
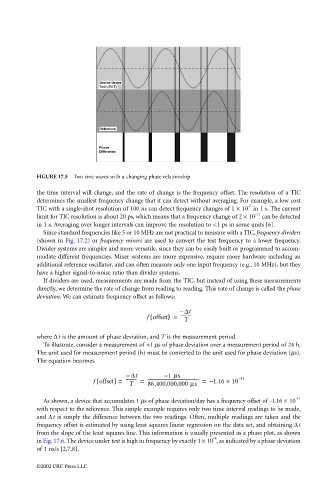
FIGURE 17.5  Two sine waves with a changing phase relationship.

                                 the time interval will change, and the rate of change is the frequency offset. The resolution of a TIC
                                 determines the smallest frequency change that it can detect without averaging. For example, a low cost
                                                                                                 -7
                                 TIC with a single-shot resolution of 100 ns can detect frequency changes of 1 × 10  in 1 s. The current
                                                                                                   -11
                                 limit for TIC resolution is about 20 ps, which means that a frequency change of 2 × 10  can be detected
                                 in 1 s. Averaging over longer intervals can improve the resolution to <1 ps in some units [6].
                                   Since standard frequencies like 5 or 10 MHz are not practical to measure with a TIC, frequency dividers
                                 (shown in Fig. 17.2) or frequency mixers are used to convert the test frequency to a lower frequency.
                                 Divider systems are simpler and more versatile, since they can be easily built or programmed to accom-
                                 modate different frequencies. Mixer systems are more expensive, require more hardware including an
                                 additional reference oscillator, and can often measure only one input frequency (e.g., 10 MHz), but they
                                 have a higher signal-to-noise ratio than divider systems.
                                   If dividers are used, measurements are made from the TIC, but instead of using these measurements
                                 directly, we determine the rate of change from reading to reading. This rate of change is called the phase
                                 deviation. We can estimate frequency offset as follows:

                                                                            –  ∆t
                                                                   (
                                                                   f offset) =  ---------
                                                                              T
                                 where ∆t is the amount of phase deviation, and T is the measurement period.
                                   To illustrate, consider a measurement of +1 µs of phase deviation over a measurement period of 24 h.
                                 The unit used for measurement period (h) must be converted to the unit used for phase deviation (µs).
                                 The equation becomes

                                                            – ∆t        – 1 µs                – 11
                                                   (
                                                  f  offset) =  ---------  =  ----------------------------------------------  =  – 1.16 ×  10
                                                             T
                                                                   86,400,000,000 µs
                                   As shown, a device that accumulates 1 µs of phase deviation/day has a frequency offset of -1.16 × 10 -11
                                 with respect to the reference. This simple example requires only two time interval readings to be made,
                                 and ∆t is simply the difference between the two readings. Often, multiple readings are taken and the
                                 frequency offset is estimated by using least squares linear regression on the data set, and obtaining ∆t
                                 from the slope of the least squares line. This information is usually presented as a phase plot, as shown
                                                                                      -9
                                 in Fig. 17.6. The device under test is high in frequency by exactly 1 × 10 , as indicated by a phase deviation
                                 of 1 ns/s [2,7,8].

                                 ©2002 CRC Press LLC