Page 374 - The Mechatronics Handbook
P. 374

0066_Frame_C18  Page 10  Wednesday, January 9, 2002  5:14 PM


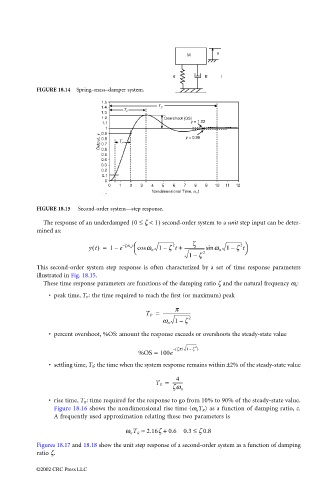
                       FIGURE 18.14  Spring–mass–damper system.


                       FIGURE 18.15   Second-order system—step response.
                         The response of an underdamped  0 ≤  ζ < 1)  second-order system to a unit step input can be deter-
                                                   (
                       mined as:
                                                                     ζ
                                                                                    2 
                                      yt() =  1 e  – ζω t  cos ω n 1 ζ t +  ------------------sin ω n 1 ζ t 
                                                               2
                                              –
                                                             –
                                                                                 –
                                                   n
                                                                    1 ζ–  2
                       This second-order system step response is often characterized by a set of time response parameters
                       illustrated in Fig. 18.15.
                         These time response parameters are functions of the damping ratio ζ and the natural frequency ω n :
                          • peak time, T P : the time required to reach the first (or maximum) peak
                                                                π
                                                       T P =  -------------------------
                                                                    2
                                                            ω n 1 ζ–
                          • percent overshoot, %OS: amount the response exceeds or overshoots the steady-state value

                                                                      2
                                                                    –
                                                     %OS =  100e  ( –  ζπ/1 ζ )
                          • settling time, T S : the time when the system response remains within ±2% of the steady-state value

                                                                4
                                                           T S =  ---------
                                                               ζω n
                          • rise time, T R : time required for the response to go from 10% to 90% of the steady-state value.
                            Figure 18.16 shows the nondimensional rise time (ω n T R ) as a function of damping ratio, z.
                            A frequently used approximation relating these two parameters is
                                                 ω n T R ≈  2.16ζ +  0.6  0.3 ≤  ζ 0.8

                       Figures 18.17 and 18.18 show the unit step response of a second-order system as a function of damping
                       ratio ζ.

                       ©2002 CRC Press LLC
   369   370   371   372   373   374   375   376   377   378   379