
Page 699 - The Mechatronics Handbook
P. 699
0066_Frame_C23 Page 7 Wednesday, January 9, 2002 1:52 PM
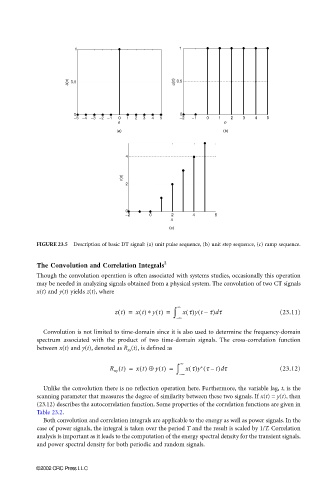
FIGURE 23.5 Description of basic DT signal: (a) unit pulse sequence, (b) unit step sequence, (c) ramp sequence.
The Convolution and Correlation Integrals 2
Though the convolution operation is often associated with systems studies, occasionally this operation
may be needed in analyzing signals obtained from a physical system. The convolution of two CT signals
x(t) and y(t) yields z(t), where
zt() = xt() ∗ yt() = ∫ ∞ x τ()yt τ) τ (23.11)
(
–
d
– ∞
Convolution is not limited to time-domain since it is also used to determine the frequency-domain
spectrum associated with the product of two time-domain signals. The cross-correlation function
between x(t) and y(t), denoted as R xy (t), is defined as
(
R xy t() = xt() ⊕ yt() = ∫ ∞ x τ()y τ t) τ (23.12)
∗
–
d
– ∞
Unlike the convolution there is no reflection operation here. Furthermore, the variable lag, t, is the
scanning parameter that measures the degree of similarity between these two signals. If x(t) = y(t), then
(23.12) describes the autocorrelation function. Some properties of the correlation functions are given in
Table 23.2.
Both convolution and correlation integrals are applicable to the energy as well as power signals. In the
case of power signals, the integral is taken over the period T and the result is scaled by 1/T. Correlation
analysis is important as it leads to the computation of the energy spectral density for the transient signals,
and power spectral density for both periodic and random signals.
©2002 CRC Press LLC