
Page 724 - The Mechatronics Handbook
P. 724
0066_Frame_C23 Page 32 Wednesday, January 9, 2002 1:53 PM
so that
∞
(
{
X ∆ iw) = xt()} ∗ { T t()} = ∑ Xi w – 2p (23.58)
------ k
T
k=−∞
Thus, the Fourier transform X ∆ of the sampled variable has a periodic extension of the original spectrum
X(iω) along the frequency axis with a period equal to the sampling frequency ω s = 2π/T. There is an
important result based on this observation known as the Shannon sampling theorem, which states that
+∞
the continuous-time variable x(t) may be reconstructed from the samples {x k } −∞ if and only if the
sampling frequency is at least twice that of the highest frequency for which X(iω) is nonzero. The original
variable x(t) may thus be recovered as
∞ sin p --- tkT–( )
T
xt() = ∑ x k ------------------------------- (23.59)
p
k=−∞ --- tkT–( )
T
The formula given in Eq. (23.59) is called Shannon interpolation, which is often quoted though it is
valid only for infinitely long data sequences and would require a noncausal filter to reconstruct the
continuous-time signal x(t) in real-time operation. The frequency ω n = ω s /2 = π/T is called the Nyquist
frequency and indicates the upper limit of distortion-free sampling. A nonzero spectrum beyond this limit
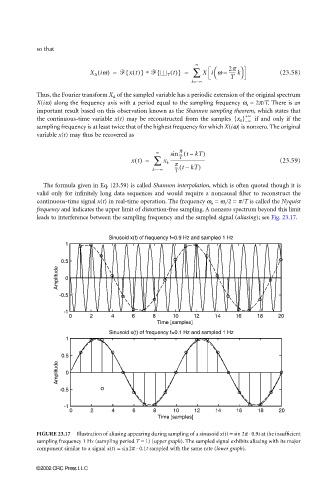
leads to interference between the sampling frequency and the sampled signal (aliasing); see Fig. 23.17.
Sinusoid x(t) of frequency f=0.9 Hz and sampled 1 Hz
1
0.5
Amplitude 0
-0.5
-1
0 2 4 6 8 10 12 14 16 18 20
Time [samples]
Sinusoid x(t) of frequency f=0.1 Hz and sampled 1 Hz
1
0.5
Amplitude 0
-0.5
-1
0 2 4 6 8 10 12 14 16 18 20
Time [samples]
FIGURE 23.17 Illustration of aliasing appearing during sampling of a sinusoid x(t) = sin 2π ⋅ 0.9t at the insufficient
sampling frequency 1 Hz (sampling period T = 1) (upper graph). The sampled signal exhibits aliasing with its major
component similar to a signal x(t) = sin2π ⋅ 0.1t sampled with the same rate (lower graph).
©2002 CRC Press LLC