
Page 741 - The Mechatronics Handbook
P. 741
0066_Frame_C23 Page 49 Wednesday, January 9, 2002 1:56 PM
Dynamic Signal
Analyzer (DSA)
Frequency-Response ω Scanning Probe
V (t)=P sin( t)
x
M (dB) Microscope (SPM)
ω (Hz) x (t)
p
(deg.) y(t)=MP sin( t+ ) φ
ω
φ Inductive
ω (Hz) Sensor
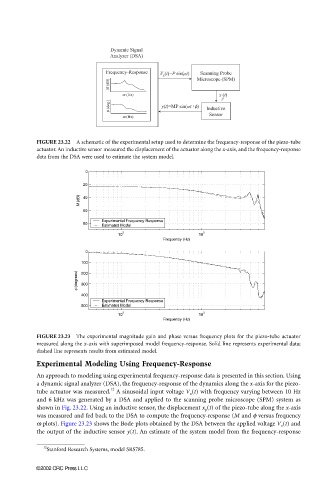
FIGURE 23.22 A schematic of the experimental setup used to determine the frequency-response of the piezo-tube
actuator. An inductive sensor measured the displacement of the actuator along the x-axis, and the frequency-response
data from the DSA were used to estimate the system model.
0
20
M (dB) 40
60
Experimental Frequency Response
80
Estimated Model
2 3
10 10
Frequency (Hz)
0
100
φ (degrees) 200
300
400
Experimental Frequency Response
500 Estimated Model
2 3
10 10
Frequency (Hz)
FIGURE 23.23 The experimental magnitude gain and phase versus frequency plots for the piezo-tube actuator
measured along the x-axis with superimposed model frequency-response. Solid line represents experimental data;
dashed line represents results from estimated model.
Experimental Modeling Using Frequency-Response
An approach to modeling using experimental frequency-response data is presented in this section. Using
a dynamic signal analyzer (DSA), the frequency-response of the dynamics along the x-axis for the piezo-
12
tube actuator was measured. A sinusoidal input voltage V x (t) with frequency varying between 10 Hz
and 6 kHz was generated by a DSA and applied to the scanning probe microscope (SPM) system as
shown in Fig. 23.22. Using an inductive sensor, the displacement x p (t) of the piezo-tube along the x-axis
was measured and fed back to the DSA to compute the frequency-response (M and φ versus frequency
ω plots). Figure 23.23 shows the Bode plots obtained by the DSA between the applied voltage V x (t) and
the output of the inductive sensor y(t). An estimate of the system model from the frequency-response
12
Stanford Research Systems, model SRS785.
©2002 CRC Press LLC