
Page 81 - Theory and Design of Air Cushion Craft
P. 81
Practical formulae for predicting air cushion performance 65
0.5 1.0 1.5 2.0 2.5 hit
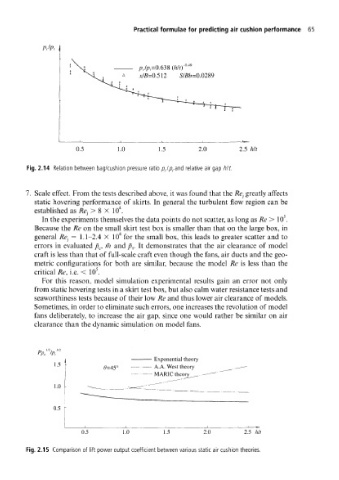
Fig. 2.14 Relation between bag/cushion pressure ratio p clp, and relative air gap hit
1. Scale effect. From the tests described above, it was found that the Re } greatly affects
static hovering performance of skirts. In general the turbulent flow region can be
4
established as Re-.>8x 10 .
5
In the experiments themselves the data points do not scatter, as long as Re > 10 .
Because the Re on the small skirt test box is smaller than that on the large box, in
4
general Re ; = 1.1-2.4 X 10 for the small box, this leads to greater scatter and to
errors in evaluated p c, in and p v It demonstrates that the air clearance of model
craft is less than that of full-scale craft even though the fans, air ducts and the geo-
metric configurations for both are similar, because the model Re is less than the
5
critical Re, i.e. < 10 .
For this reason, model simulation experimental results gain an error not only
from static hovering tests in a skirt test box, but also calm water resistance tests and
seaworthiness tests because of their low Re and thus lower air clearance of models.
Sometimes, in order to eliminate such errors, one increases the revolution of model
fans deliberately, to increase the air gap, since one would rather be similar on air
clearance than the dynamic simulation on model fans.
r> 1
PP«
Exponential theory
0=45 A.A. West theory
0.5
0.5 1.5 2.5 hit
Fig. 2.15 Comparison of lift power output coefficient between various static air cushion theories.