
Page 441 - Thomson, William Tyrrell-Theory of Vibration with Applications-Taylor _ Francis (2010)
P. 441
428 Random Vibrations Chap. 13
The variance previously defined as the mean square value about the
mean, is
cr~ = I ( x - I ) ^ p ( x ) d x
=- / x^p(x) ¿Lx — 2x xp(x) dx-\- ( x)^ p(x) dx
d_ d - 'V' d-
= A^ - 2 ( x ) ‘ +(■<•)"
'
= - { x f (13.4-7)
The standard deviation cr is the positive square root of the variance. When the
mean value is zero, a = ]/x~, and the standard deviation is equal to the root-
mean-square (rms) value.
Gaussian and Rayleigh distributions. Certain distributions that occur
frequently in nature are the Gaussian (or normal) distribution and the Rayleigh
distribution, both of which can be expressed mathematically. The Gaussian distri
bution is a bell-shaped curve, symmetric about the mean value (which will be
assumed to be zero) with the following equation:
p(x) = (13.4-8)
r]/2jr
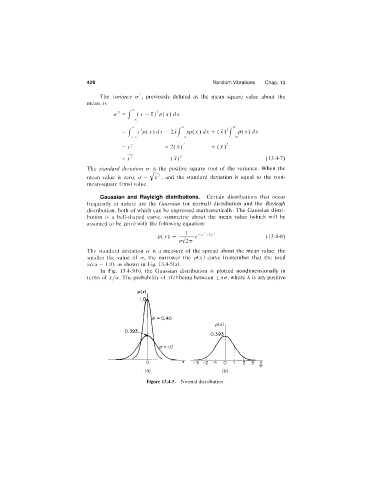
The standard deviation rr is a measure of the spread about the mean value; the
smaller the value of a, the narrower the p(x) curve (remember that the total
area 1.0), as shown in Fig. 13.4-5(a).
In Fig. 13.4-5(b), the Gaussian distribution is plotted nondirnensionally in
terms of x/cr. The probability of x(t) being between TArr, where A is any positive
Figure 13.4-5. Normal distribution.