
Page 446 - Thomson, William Tyrrell-Theory of Vibration with Applications-Taylor _ Francis (2010)
P. 446
Sec. 13.5 Correlation 433
R{t)
Wide-bond noise x{f)
/ A .
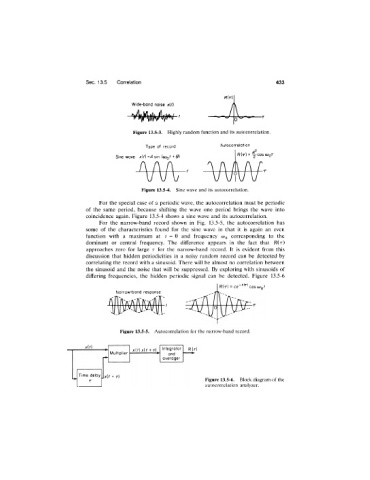
Figure 13.5-3. Highly random function and its autocorrelation.
Type of record Autocorrelotion
RM = Y cos coqT
Sine wove xi f)=As\ n iwQt +Û)
Figure 13.5-4. Sine wave and its autocorrelation.
For the special case of a periodic wave, the autocorrelation must be periodic
of the same period, because shifting the wave one period brings the wave into
coincidence again. Figure 13.5-4 shows a sine wave and its autocorrelation.
For the narrow-band record shown in Fig. 13.5-5, the autocorrelation has
some of the characteristics found for the sine wave in that it is again an even
function with a maximum at r = 0 and frequency îUq corresponding to the
dominant or central frequency. The difference appears in the fact that R(r)
approaches zero for large r for the narrow-band record. It is evident from this
discussion that hidden periodicities in a noisy random record can be detected by
correlating the record with a sinusoid. There will be almost no correlation between
the sinusoid and the noise that will be suppressed. By exploring with sinusoids of
differing frequencies, the hidden periodic signal can be detected. Figure 13.5-6
Narrow-band response
Figure 13.5-5. Autocorrelation for the narrow-band record.
Figure 13.5-6. Block diagram of the
autocorrelation analyzer.