
Page 450 - Thomson, William Tyrrell-Theory of Vibration with Applications-Taylor _ Francis (2010)
P. 450
Sec. 13.6 Power Spectrum and Power Spectral Density. 437
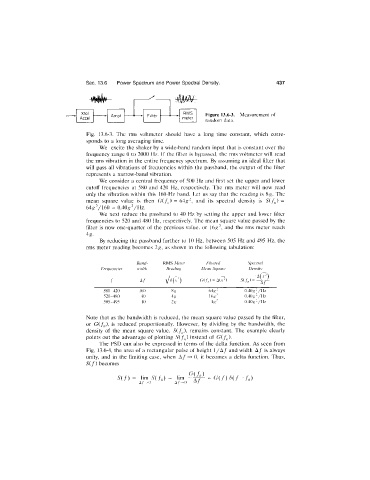
Xtal RMS Figure 13.6-3. Measurement of
Ampi Filter
Accel meter random data.
Fig. 13.6-3. The rms voltmeter should have a long time constant, which corre
sponds to a long averaging time.
We excite the shaker by a wide-band random input that is constant over the
frequency range 0 to 2000 Hz. If the filter is bypassed, the rms voltmeter will read
the rms vibration in the entire frequency spectrum. By assuming an ideal filter that
will pass all vibrations of frequencies within the passband, the output of the filter
represents a narrow-band vibration.
We consider a central frequency of 500 Hz and first set the upper and lower
cutoff frequencies at 580 and 420 Hz, respectively. The rms meter will now read
only the vibration within this 160-Hz band. Let us say that the reading is 8g. The
mean square value is then G ifJ = 6 4 and its spectral density is 5'(/,,) =
6 4 g ^ / m = 0.40gVHz.
We next reduce the passband to 40 Hz by setting the upper and lower filter
frequencies to 520 and 480 Hz, respectively. The mean square value passed by the
filter is now one-quarter of the previous value, or 16^^^, and the rms meter reads
4g.
By reducing the passband further to 10 Hz, between 505 Hz and 495 Hz, the
rms meter reading becomes 2g, as shown in the following tabulation:
Band RM S Meter Filtered Spectral
Frequencies width Reading Mean Square Density
f A / G (./;,)= A(a- )
5 8 0-420 160 6 4 ^ - 0.40<í^VHz
5 2 0-480 40 16.G 0.40^-VHz
505-495 10 2/Í 4 ^ - OAOg^/Hz
Note that as the bandwidth is reduced, the mean square value passed by the filter,
or G(/^), is reduced proportionally. However, by dividing by the bandwidth, the
density of the mean square value, SifJ, remains constant. The example clearly
points out the advantage of plotting Sif^^) instead of G(/„).
The PSD can also be expressed in terms of the delta function. As seen from
Fig. 13.6-4, the area of a rectangular pulse of height 1/A / and width A / is always
unity, and in the limiting case, when A / 0, it becomes a delta function. Thus,
S(f) becomes
G(f,]
S { f ) = WmSi f , ) lim G ( / ) 5 ( / - / , )
A/'-^O A /-^() A/