Page 449 - Thomson, William Tyrrell-Theory of Vibration with Applications-Taylor _ Francis (2010)
P. 449

436                                       Random Vibrations   Chap. 13

                                  S(fn)


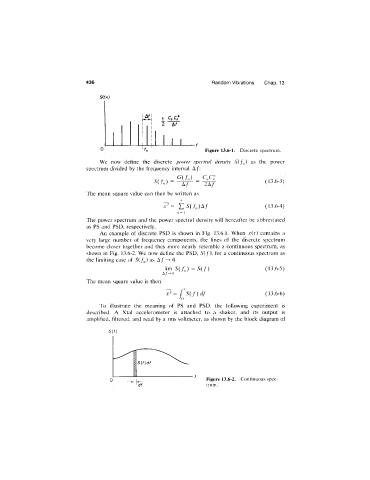
                                                                     Figure  13.6-1.  Discrete  spectrum.
                                  We  now  define  the  discrete  power  spectral  density  S(f^)  as  the  power
                              spectrum  divided by the  frequency  interval  A/:
                                                            G (/„ )   c „ c
                                                    S{fn)  =                             (13.6-3)

                              The  mean  square value  can  then  be written  as
                                                             00
                                                                                         (13.6-4)
                                                              1
                              The  power spectrum  and  the  power  spectral  density will  hereafter be  abbreviated
                              as  PS  and  PSD,  respectively.
                                  An  example  of discrete  PSD  is  shown  in  Fig.  13.6.1.  When  x{t)  contains  a
                              very  large  number  of  frequency  components,  the  lines  of  the  discrete  spectrum
                              become  closer together and  they  more  nearly  resemble  a  continuous  spectrum,  as
                              shown  in  Fig.  13.6-2.  We  now define  the  PSD,  A(/),  for a continuous spectrum  as
                              the  limiting case of  S(f^) as  A / ^   0.
                                                       lim  S { f „ ) =S ( f )           (13.6-5)
                                                       A/^0
                              The  mean  square value  is then
                                                             r s ( f ) d f               (13.6-6)
                                                            •'n
                                  To  illustrate  the  meaning  of  PS  and  PSD,  the  following  experiment  is
                              described.  A  Xtal  accelerometer  is  attached  to  a  shaker,  and  its  output  is
                              amplified,  filtered,  and  read by a rms voltmeter,  as shown by the  block diagram of

                                     S{f)


                                                                     Figure 13.6-2.  Continuous spec­
                                                                     trum.
   444   445   446   447   448   449   450   451   452   453   454