
Page 20 - Thermodynamics of Biochemical Reactions
P. 20
1.5 Production of Hydrogen Ions and Magnesium Ions 13
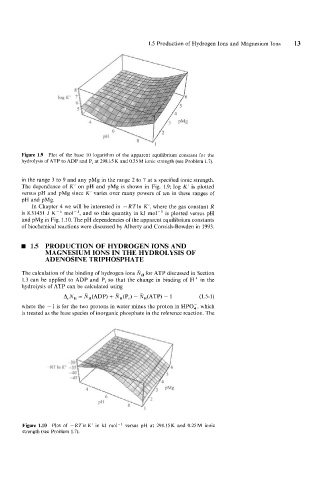
Figure 1.9 Plot of the base 10 logarithm of the apparent equilibrium constant for the
hydrolysis of ATP to ADP and Pi at 298.15 K and 0.25 M ionic strength (see Problem 1.7).
in the range 3 to 9 and any pMg in the range 2 to 7 at a specified ionic strength.
The dependence of K' on pH and pMg is shown in Fig. 1.9; log K' is plotted
versus pH and pMg since K' varies over many powers of ten in these ranges of
pH and pMg.
In Chapter 4 we will be interested in -RTln K', where the gas constant R
is 8.31451 J K-l mol-', and so this quantity in kJ mol-I is plotted versus pH
and pMg in Fig. 1.10. The pH dependencies of the apparent equilibrium constants
of biochemical reactions were discussed by Alberty and Cornish-Bowden in 1993.
1.5 PRODUCTION OF HYDROGEN IONS AND
MAGNESIUM IONS IN THE HYDROLYSIS OF
ADENOSINE TRIPHOSPHATE
The calculation of the binding of hydrogen ions N, for ATP discussed in Section
1.3 can be applied to ADP and Pi so that the change in binding of H+ in the
hydrolysis of ATP can be calculated using
ArNH = &J,(ADP) + NH(Pi) - N,(ATP) - 1 (1.5-1)
where the - 1 is for the two protons in water minus the proton in HPO,, which
is treated as the base species of inorganic phosphate in the reference reaction. The
Figure 1.10 Plot of -RTlnK' in kJ mol-' versus pH at 298.15K and 0.25M ionic
strength (see Problem 1.7).