
Page 17 - Thermodynamics of Biochemical Reactions
P. 17
10 Introduction to Apparent Equilibrium Constants
3 4 5 6 7
Figure 1.5 Binding of magnesium ions by ATP at 298.15 K. I = 0.25 M, and pH 3, 4, 5,
6, 7, 8, and 9 (see Problem 1.4).
a MgCl, solution with [Mg2+] = lop2 M at ionic strength 0.25 M. Experimental
plots of this type make it possible to calculate K,,,, and K,,,, (Smith and
Alberty, 1956).
Figure 1.5 shows a plot of mMg versus pMg at several values of pH. As the
hydrogen ion concentration is increased, the binding of magnesium ions is
decreased because of the competition for the same sites.
Equations 1.3-15 and 1.3-16 can be used to make three-dimensional plots of
NMg and as functions of pH and pMg. These plots are given in Figs. 1.6 and 1.7.
The back plane of Fig. 1.6 gives the hydrogen ion binding of ATP in the essential
absence of Mg (more accurately, pMg > 6). At pMg 2 the apparent second pK
of ATP is less than 5. Figure 1.7 shows that below pMg 5 there is essentially no
binding of magnesium ion and that binding increases to a number a little greater
than 1 at pMg 2 and pH > 6 but is eliminated by further reduction of the pH.
Figures 1.4 to 1.7 can also be obtained by plotting derivatives of the binding
potential (see equations 1.3-13 and 1.3-14), rather than by use of equations 1.3-15
and 1.3-16 (see Problems 1.5 and 1.6).
A remarkable fact about Figs. 1.6 and 1.7 is that at any given pH and pMg.
in Fig. 1.6, the slope in the pMg direction is the same as the slope in pH direction
in Fig. 1.7 at that pH and pMg. This is because the mixed partial derivatives of
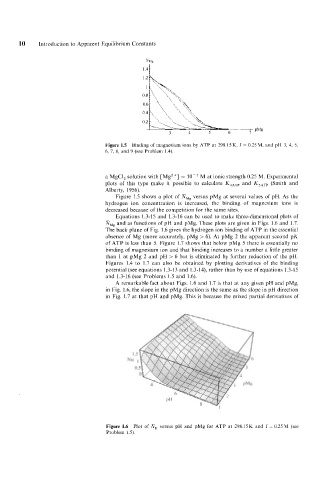
Figure 1.6 Plot of NH versus pH and pMg for ATP at 298.15 K and I = 0.25 M (see
Problem 1.5).