
Page 64 - Using ANSYS for Finite Element Analysis A Tutorial for Engineers
P. 64
IntroductIon to FInIte element AnAlysIs • 51
curved surfaces. If the two analyses yield similar solutions, we suspect
that results are not much in error. Or, we might establish a sequence of
solutions by solving the problem more than twice, using a finer mesh each
time. By studying how the sequence converges, we may be able to state
with some confidence that the results from the finest mesh are in error by
less than, say, 5 percent.
1.9.3 nuMerical error
After the analyst has introduced modeling error and discretization error, the
computer introduces numerical error by rounding or truncating numbers
as it builds matrices and solves equations. Usually, the numerical error is
small, but some modeling practices can greatly increase it.
FE computer programs have become widely available, easier to use,
and can display results with attractive graphics. Even an inept user can
produce some kind of answer. It is hard to disbelieve FE results because of
the effort needed to get them and the polish of their presentation. But, any
model, good or bad, can produce smooth and colorful stress contours. It
is possible that most FEAs are so flawed that they cannot be trusted. Even
a poor mesh, inappropriate element types, incorrect loads, or improper
supports may produce results that appear reasonable on casual inspection.
200 mm 20 mm
1-ms presuure pulse 4 mm
10
3c
2
3c
5 2 9
5
Displacement, mm 0 2 8 3b 10 5 9 7
7
10
–5 7 1 9 8 1 3b
5 8
1
10
–10
0 1 2 3 4 5 6 7
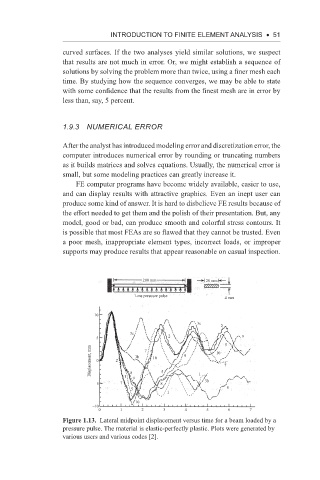
Figure 1.13. Lateral midpoint displacement versus time for a beam loaded by a
pressure pulse. The material is elastic-perfectly plastic. Plots were generated by
various users and various codes [2].