
Page 128 - Vibrational Spectroscopic Imaging for Biomedical Applications
P. 128
104 Cha pte r F o u r
(b)
(a)
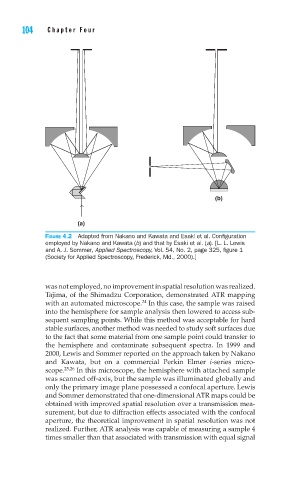
FIGURE 4.2 Adapted from Nakano and Kawata and Esaki et al. Confi guration
employed by Nakano and Kawata (b) and that by Esaki et al. (a). [L. L. Lewis
and A. J. Sommer, Applied Spectroscopy, Vol. 54, No. 2, page 325, fi gure 1
(Society for Applied Spectroscopy, Frederick, Md., 2000).]
was not employed, no improvement in spatial resolution was realized.
Tajima, of the Shimadzu Corporation, demonstrated ATR mapping
24
with an automated microscope. In this case, the sample was raised
into the hemisphere for sample analysis then lowered to access sub-
sequent sampling points. While this method was acceptable for hard
stable surfaces, another method was needed to study soft surfaces due
to the fact that some material from one sample point could transfer to
the hemisphere and contaminate subsequent spectra. In 1999 and
2000, Lewis and Sommer reported on the approach taken by Nakano
and Kawata, but on a commercial Perkin Elmer i-series micro-
scope. 25,26 In this microscope, the hemisphere with attached sample
was scanned off-axis, but the sample was illuminated globally and
only the primary image plane possessed a confocal aperture. Lewis
and Sommer demonstrated that one-dimensional ATR maps could be
obtained with improved spatial resolution over a transmission mea-
surement, but due to diffraction effects associated with the confocal
aperture, the theoretical improvement in spatial resolution was not
realized. Further, ATR analysis was capable of measuring a sample 4
times smaller than that associated with transmission with equal signal