
Page 137 - Vibrational Spectroscopic Imaging for Biomedical Applications
P. 137
Evanescent W ave Imaging 113
sample type is known as the reststrahlen effect, in which the sample
becomes a perfect reflector near an absorption band. Last it should be
remembered that the refractive index of a sample changes dramatically in
and around an absorption. These effects manifest themselves in the spec-
tra in a variety of ways and make the interpretation of the spectra and the
identification of disease states very difficult. From a quantitative perspec-
tive, the adherence of the Beer Lambert law dictates that the sole mecha-
nism for the attenuation of light must be absorption and that the optical
path length through the sample be well known.
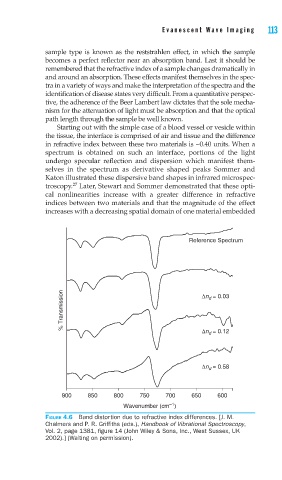
Starting out with the simple case of a blood vessel or vesicle within
the tissue, the interface is comprised of air and tissue and the difference
in refractive index between these two materials is ~0.40 units. When a
spectrum is obtained on such an interface, portions of the light
undergo specular reflection and dispersion which manifest them-
selves in the spectrum as derivative shaped peaks Sommer and
Katon illustrated these dispersive band shapes in infrared microspec-
27
troscopy. Later, Stewart and Sommer demonstrated that these opti-
cal nonlinearities increase with a greater difference in refractive
indices between two materials and that the magnitude of the effect
increases with a decreasing spatial domain of one material embedded
Reference Spectrum
% Transmission Δn = 0.03
d
Δn = 0.12
d
= 0.58
Δn d
900 850 800 750 700 650 600
–1
Wavenumber (cm )
FIGURE 4.6 Band distortion due to refractive index differences. [J. M.
Chalmers and P. R. Griffi ths (eds.), Handbook of Vibrational Spectroscopy,
Vol. 2, page 1381, fi gure 14 (John Wiley & Sons, Inc., West Sussex, UK
2002).] (Waiting on permission).