
Page 139 - Vibrational Spectroscopic Imaging for Biomedical Applications
P. 139
Evanescent W ave Imaging 115
KBr pellets were employed in the early days of infrared to eliminate
these artifacts. A similar approach can be taken for tissue samples,
where the tissue is immersed in Nujol. This approach can readily be
implemented by applying a few drops of Nujol to the sample and
placing a 1-mm-thick barium fluoride cover slip on top. Although the
addition of Nujol may not be an optimal solution, most tissue sections
are mounted in paraffin and then subsequently deparaffinized. A con-
sideration might be to leave the paraffin intact for those samples to be
studied via infrared microspectroscopy, or to use the ATR method.
In the more complicated case of a mineral inclusion in the tissue,
scattering, diffraction, and the reststrahlen effect come into play. Grahlert
has addressed some issues related to scattering in TF measurements of
43
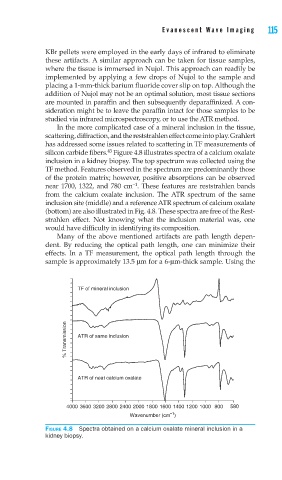
silicon carbide fibers. Figure 4.8 illustrates spectra of a calcium oxalate
inclusion in a kidney biopsy. The top spectrum was collected using the
TF method. Features observed in the spectrum are predominantly those
of the protein matrix; however, positive absorptions can be observed
−1
near 1700, 1322, and 780 cm . These features are reststrahlen bands
from the calcium oxalate inclusion. The ATR spectrum of the same
inclusion site (middle) and a reference ATR spectrum of calcium oxalate
(bottom) are also illustrated in Fig. 4.8. These spectra are free of the Rest-
strahlen effect. Not knowing what the inclusion material was, one
would have difficulty in identifying its composition.
Many of the above mentioned artifacts are path length depen-
dent. By reducing the optical path length, one can minimize their
effects. In a TF measurement, the optical path length through the
sample is approximately 13.5 μm for a 6-μm-thick sample. Using the
TF of mineral inclusion
% Transmission ATR of same inclusion
ATR of neat calcium oxalate
4000 3600 3200 2800 2400 2000 1800 1600 1400 1200 1000 800 580
–1
Wavenumber (cm )
FIGURE 4.8 Spectra obtained on a calcium oxalate mineral inclusion in a
kidney biopsy.