
Page 143 - Vibrational Spectroscopic Imaging for Biomedical Applications
P. 143
Evanescent W ave Imaging 119
4.7 ATR Microspectroscopic Raman Imaging
Although ATR Raman spectroscopy was first reported in 1976, the
first report and several that followed employed very high-excitation
powers at the sample, long collection times and large samples that
were relatively strong scatterers. 50–53 Since these initial reports, the
field of Raman spectroscopy has seen many technological advances.
The application of the ATR method to microscopic investigations has
taken place only recently. The primary impetus for all previous studies
was again based on the surface sensitivity of the method. In addition,
the ATR method has an added benefit for axial discrimination over
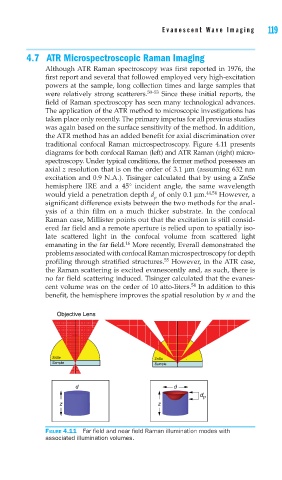
traditional confocal Raman microspectroscopy. Figure 4.11 presents
diagrams for both confocal Raman (left) and ATR Raman (right) micro-
spectroscopy. Under typical conditions, the former method possesses an
axial z resolution that is on the order of 3.1 μm (assuming 632 nm
excitation and 0.9 N.A.). Tisinger calculated that by using a ZnSe
hemisphere IRE and a 45° incident angle, the same wavelength
would yield a penetration depth d of only 0.1 μm. 44,54 However, a
p
significant difference exists between the two methods for the anal-
ysis of a thin film on a much thicker substrate. In the confocal
Raman case, Millister points out that the excitation is still consid-
ered far field and a remote aperture is relied upon to spatially iso-
late scattered light in the confocal volume from scattered light
16
emanating in the far field. More recently, Everall demonstrated the
problems associated with confocal Raman microspectroscopy for depth
55
profiling through stratified structures. However, in the ATR case,
the Raman scattering is excited evanescently and, as such, there is
no far field scattering induced. Tisinger calculated that the evanes-
54
cent volume was on the order of 10 atto-liters. In addition to this
benefit, the hemisphere improves the spatial resolution by n and the
Objective Lens
ZnSe
ZnSe
Sample
Sample
d d
d p
z z
FIGURE 4.11 Far fi eld and near fi eld Raman illumination modes with
associated illumination volumes.