
Page 141 - Vibrational Spectroscopic Imaging for Biomedical Applications
P. 141
Evanescent W ave Imaging 117
μm
200
200 μm
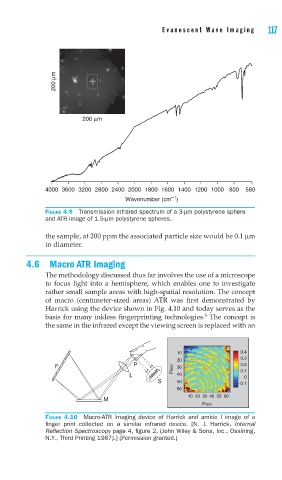
4000 3600 3200 2800 2400 2000 1800 1600 1400 1200 1000 800 580
–1
Wavenumber (cm )
FIGURE 4.9 Transmission infrared spectrum of a 3-μm polystyrene sphere
and ATR image of 1.5-μm polystyrene spheres.
the sample, at 200 ppm the associated particle size would be 0.1 μm
in diameter.
4.6 Macro ATR Imaging
The methodology discussed thus far involves the use of a microscope
to focus light into a hemisphere, which enables one to investigate
rather small sample areas with high-spatial resolution. The concept
of macro (centimeter-sized areas) ATR was first demonstrated by
Harrick using the device shown in Fig. 4.10 and today serves as the
5
basis for many inkless fingerprinting technologies. The concept is
the same in the infrared except the viewing screen is replaced with an
10 0.4
0.3
20
F P Pixel 30 0.2
L 40 0.1 0
S 50 –0.1
60
10 20 30 40 50 60
M
Pixel
FIGURE 4.10 Macro-ATR imaging device of Harrick and amide I image of a
fi nger print collected on a similar infrared device. [N. J. Harrick, Internal
Refl ection Spectroscopy page 4, fi gure 2, (John Wiley & Sons, Inc., Ossining,
N.Y., Third Printing 1987).] (Permission granted.)