
Page 138 - Vibrational Spectroscopic Imaging for Biomedical Applications
P. 138
114 Cha pte r F o u r
in the other. 39,40 Figure 4.6 illustrates the effects of dispersion in the
absence of scattering. The spectra were collected on a polyethylene
terephthalate sample (n = 1.58) whose cross section was 17 × 17 μm. The
data demonstrate that as the refractive index difference increases between
the sample and its surroundings, the infrared band shapes become asym-
metric. This asymmetry is usually observed when specular reflection dom-
inates the measurement. Sommer discussed how these effects and the
structure of the sample could have adverse effects on a quantitative anal-
40
ysis. Bhargava studied these anomalies in phase separated polymer
systems and showed how they impacted the study of the interface. 41
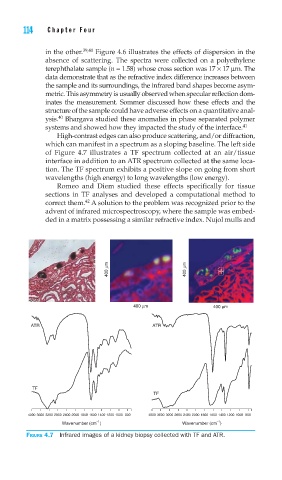
High-contrast edges can also produce scattering, and/or diffraction,
which can manifest in a spectrum as a sloping baseline. The left side
of Figure 4.7 illustrates a TF spectrum collected at an air/tissue
interface in addition to an ATR spectrum collected at the same loca-
tion. The TF spectrum exhibits a positive slope on going from short
wavelengths (high energy) to long wavelengths (low energy).
Romeo and Diem studied these effects specifically for tissue
sections in TF analyses and developed a computational method to
42
correct them. A solution to the problem was recognized prior to the
advent of infrared microspectroscopy, where the sample was embed-
ded in a matrix possessing a similar refractive index. Nujol mulls and
400 μm 400 μm
400 μm 400 μm
ATR ATR
TF
TF
4000 3600 3200 2800 2400 2000 1800 1600 1400 1200 1000 800 4000 3600 3200 2800 2400 2000 1800 1600 1400 1200 1000 800
–1
–1
Wavenumber (cm ) Wavenumber (cm )
FIGURE 4.7 Infrared images of a kidney biopsy collected with TF and ATR.