
Page 171 - Vibrational Spectroscopic Imaging for Biomedical Applications
P. 171
sFTIR, Raman, and SERS Imaging of Fungal Cells 147
(a) (b)
10 μm 10 μm
(c)
2300
2200
2100
2000
Intensity Counts 1800
1900
1700
1600
1500
1400
1300
1200
1000
950 1000 1050 1100 1150 1200 1250
–1
Raman Shift (cm )
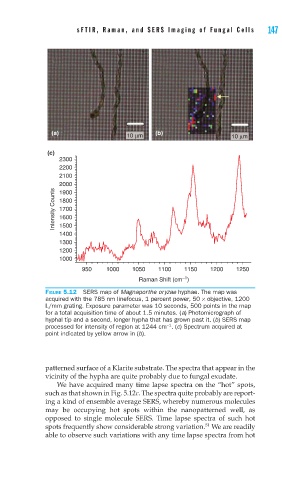
FIGURE 5.12 SERS map of Magnaporthe oryzae hyphae. The map was
acquired with the 785 nm linefocus, 1 percent power, 50 × objective, 1200
L/mm grating. Exposure parameter was 10 seconds, 500 points in the map
for a total acquisition time of about 1.5 minutes. (a) Photomicrograph of
hyphal tip and a second, longer hypha that has grown past it. (b) SERS map
−1
processed for intensity of region at 1244 cm . (c) Spectrum acquired at
point indicated by yellow arrow in (b).
patterned surface of a Klarite substrate. The spectra that appear in the
vicinity of the hypha are quite probably due to fungal exudate.
We have acquired many time lapse spectra on the “hot” spots,
such as that shown in Fig. 5.12c. The spectra quite probably are report-
ing a kind of ensemble average SERS, whereby numerous molecules
may be occupying hot spots within the nanopatterned well, as
opposed to single molecule SERS. Time lapse spectra of such hot
51
spots frequently show considerable strong variation. We are readily
able to observe such variations with any time lapse spectra from hot