
Page 172 - Vibrational Spectroscopic Imaging for Biomedical Applications
P. 172
148 Cha pte r F i v e
spots; however, such data are not reproducible and evidence of
sample decomposition often appears after extended dwell times.
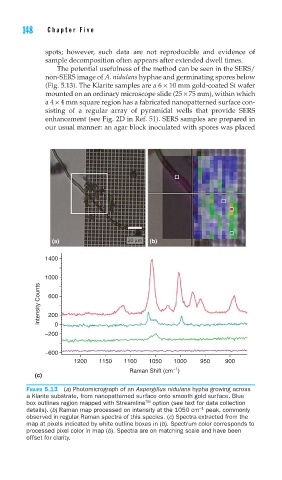
The potential usefulness of the method can be seen in the SERS/
non-SERS image of A. nidulans hyphae and germinating spores below
(Fig. 5.13). The Klarite samples are a 6 × 10 mm gold-coated Si wafer
mounted on an ordinary microscope slide (25 × 75 mm), within which
a 4 × 4 mm square region has a fabricated nanopatterned surface con-
sisting of a regular array of pyramidal wells that provide SERS
enhancement (see Fig. 2D in Ref. 51). SERS samples are prepared in
our usual manner: an agar block inoculated with spores was placed
(a) (b)
1400
1000
Intensity Counts 600
200
–200 0
–600
1200 1150 1100 1050 1000 950 900
–1
Raman Shift (cm )
(c)
FIGURE 5.13 (a) Photomicrograph of an Aspergillus nidulans hypha growing across
a Klarite substrate, from nanopatterned surface onto smooth gold surface. Blue
TM
box outlines region mapped with Streamline option (see text for data collection
details). (b) Raman map processed on intensity at the 1050 cm peak, commonly
−1
observed in regular Raman spectra of this species. (c) Spectra extracted from the
map at pixels indicated by white outline boxes in (b). Spectrum color corresponds to
processed pixel color in map (b). Spectra are on matching scale and have been
offset for clarity.