
Page 174 - Vibrational Spectroscopic Imaging for Biomedical Applications
P. 174
150 Cha pte r F i v e
900
SERS
800 Raman
Intensity Counts 600 10200
700
10000
9800
9600
9400
900 950 1000 1050 1100 1150 1200
–1
Raman Shift (cm )
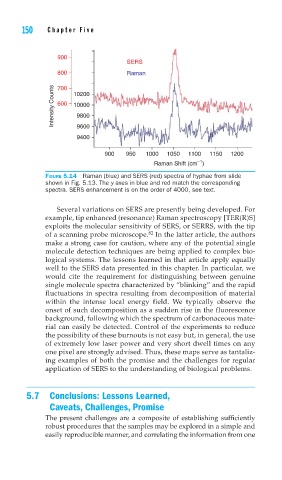
FIGURE 5.14 Raman (blue) and SERS (red) spectra of hyphae from slide
shown in Fig. 5.13. The y axes in blue and red match the corresponding
spectra. SERS enhancement is on the order of 4000, see text.
Several variations on SERS are presently being developed. For
example, tip enhanced (resonance) Raman spectroscopy [TER(R)S]
exploits the molecular sensitivity of SERS, or SERRS, with the tip
82
of a scanning probe microscope. In the latter article, the authors
make a strong case for caution, where any of the potential single
molecule detection techniques are being applied to complex bio-
logical systems. The lessons learned in that article apply equally
well to the SERS data presented in this chapter. In particular, we
would cite the requirement for distinguishing between genuine
single molecule spectra characterized by “blinking” and the rapid
fluctuations in spectra resulting from decomposition of material
within the intense local energy field. We typically observe the
onset of such decomposition as a sudden rise in the fluorescence
background, following which the spectrum of carbonaceous mate-
rial can easily be detected. Control of the experiments to reduce
the possibility of these burnouts is not easy but, in general, the use
of extremely low laser power and very short dwell times on any
one pixel are strongly advised. Thus, these maps serve as tantaliz-
ing examples of both the promise and the challenges for regular
application of SERS to the understanding of biological problems.
5.7 Conclusions: Lessons Learned,
Caveats, Challenges, Promise
The present challenges are a composite of establishing sufficiently
robust procedures that the samples may be explored in a simple and
easily reproducible manner, and correlating the information from one