
Page 356 - Vibrational Spectroscopic Imaging for Biomedical Applications
P. 356
330 Cha pte r Ele v e n
1.10
(a)
Relative CARS Intensity 1.00
1.05
0.95
(b)
1.0
0.8
Im (X (3) ) 0.6
0.4
0.2
0.0
800 900 1000 1100 1200
–1
Wavenumber (cm )
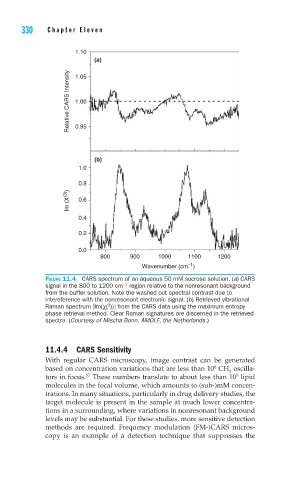
FIGURE 11.4 CARS spectrum of an aqueous 50 mM sucrose solution. (a) CARS
−1
signal in the 800 to 1200 cm region relative to the nonresonant background
from the buffer solution. Note the washed out spectral contrast due to
intereference with the nonresonant electronic signal. (b) Retrieved vibrational
3
Raman spectrum [Im(χ( ))] from the CARS data using the maximum entropy
phase retrieval method. Clear Raman signatures are discerned in the retrieved
spectra. (Courtesy of Mischa Bonn, AMOLF, the Netherlands.)
11.4.4 CARS Sensitivity
With regular CARS microscopy, image contrast can be generated
6
based on concentration variations that are less than 10 CH oscilla-
2
5
57
tors in focus. These numbers translate to about less than 10 lipid
molecules in the focal volume, which amounts to (sub-)mM concen-
trations. In many situations, particularly in drug delivery studies, the
target molecule is present in the sample at much lower concentra-
tions in a surrounding, where variations in nonresonant background
levels may be substantial. For these studies, more sensitive detection
methods are required. Frequency modulation (FM-)CARS micros-
copy is an example of a detection technique that suppresses the